For school leaders who are visual learners, a newly released and highly detailed interactive map is revealing key trends about the strength of the teacher workforce and the severity of ongoing shortages.
The map and accompanying resources created by the nonprofit Learning Policy Institute track state-by-state variances in shortages, working conditions, and student access to experienced and fully certified teachers across subject matter. The organization has also zeroed in on the number of positions that are vacant or filled by non-certified educators in each state to estimate that the U.S. school system is short about 314,000 teachers.
The map centers on two key metrics:
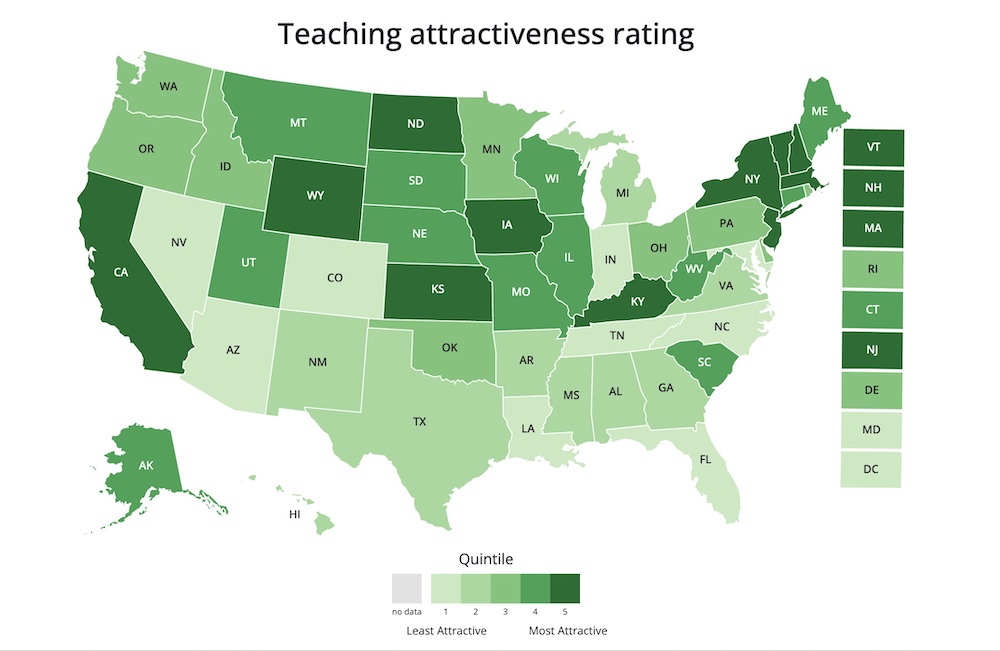
- Teaching attractiveness: Do conditions in each state support teacher recruitment and retention?
- Teacher equity: Do students in high-poverty and high-minority schools have equitable access to high-quality teachers?
More from DA: One superintendent quits after just a month and another gets a huge raise
The Institute ranked states for teaching attractiveness based on starting salary, classroom autonomy, per-pupil spending and the number of teachers who have expressed plans to leave the profession, among other factors. Equity was measured by the gaps in the percentage of uncertified and inexperienced teachers between higher- and lower-minority schools, and similar metrics.
What’s trending in the teacher workforce
The map reveals six key trends :
- Best places to teach in the United States: Vermont, North Dakota, New Hampshire, Kansas, New York, California, Wyoming, Kentucky, New Jersey, Iowa and Massachusetts have the highest teaching attractiveness ratings.
Learning Policy Institute (Click for a deeper dive) - Where students have the least equitable access to qualified teachers: Several states with high proportions of students of color and students from low-income backgrounds—including Louisiana, Maryland, Arizona, Mississippi and New York—provide the least equitable access to certified and experienced teachers.
- Changes in teacher-preparation program enrollment: Interest in teaching is at its lowest point in decades despite wide variations. Over the last five years, the number of people completing teacher preparation programs in Florida has decreased by nearly 40% while Washington has seen an increase of more than 20%.
- Estimated total number of teachers not fully certified for their teaching assignments and unfilled positions: There are about 286,300 educators not fully certified for their teaching assignments and nearly 28,000 unfilled positions based on data from the 2020–21 or 2021–22 school years.
- Workforce characteristics: The map shows the total number of teachers of color, the ratio of adults of color to teachers of color, teachers over 60 years old and the change in the size of the teacher workforce over the past five years.
- Teacher financial strain: The map also tracks the number of teachers who are also working outside the school system, how much money they spend on classroom supplies and how much they owe in student loans.