Reducing Student Suspension Rates

Summary
This policy brief is part of a larger research report, Making ESSA’s Equity Promise Real: State Strategies to Close the Opportunity Gap, that describes how states are using opportunities in ESSA to better support historically underserved students through the thoughtful selection of specific equity measures in their accountability and improvement systems. To this end, the full report suggests focusing attention on students furthest from opportunity by taking steps to
- reduce rates of student suspension;
- build a positive school climate;
- reduce rates of chronic absenteeism;
- implement an extended-year graduation rate; and
- expand access to a college- and career-ready curriculum.
This brief focuses on state efforts to reduce student suspension rates. For the full report, go here.
Introduction
The Every Student Succeeds Act (ESSA), passed in December 2015, gives states the opportunity to create new approaches to school accountability and continuous improvement. These approaches, if informed by well-chosen indicators of school opportunity and performance, have the potential to create more inclusive and equitable learning environments for historically underserved students.
Along with measures of academic achievement (student performance on state assessments in English language arts and mathematics, which may include growth in proficiency), graduation rates, and English language proficiency, ESSA requires states to include at least one indicator of school quality or student success.
All indicators must provide valid, reliable, and comparable information within each state’s accountability system. States then use school performance on these indicators to identify schools for either comprehensive support and improvement or targeted support and improvement. Districts with such schools can use data from statewide indicators to inform the needs assessments and school improvement plans required under ESSA. States can also select additional indicators to use as part of their broader continuous school improvement efforts across all schools, regardless of identification status.
Now that all states have received approval from the U.S. Department of Education for their plans for statewide accountability and improvement systems, a number of states are taking advantage of the opportunities provided by ESSA to measure the extent to which their students are supported and provided with equitable educational opportunities.
This brief specifies which states are making efforts to reduce suspension rates in their ESSA plans and describes how some states intend to measure and use information from this indicator to create more equitable and inclusive learning environments for all students.
Reducing Suspension Rates
Over the past several decades, researchers have noted that the overuse of suspensions and expulsions, particularly for students of color, has contributed significantly to dropout rates and the perpetuation of the “school-to-prison pipeline.” Further, students of color and those with disabilities are suspended at a rate that is disproportionate to that of their White and nondisabled peers for comparable behaviors. High rates of school exclusion have been encouraged by zero-tolerance policies, which assign explicit, predetermined punishments to specific violations of school rules, regardless of the situation or the context of the behavior.
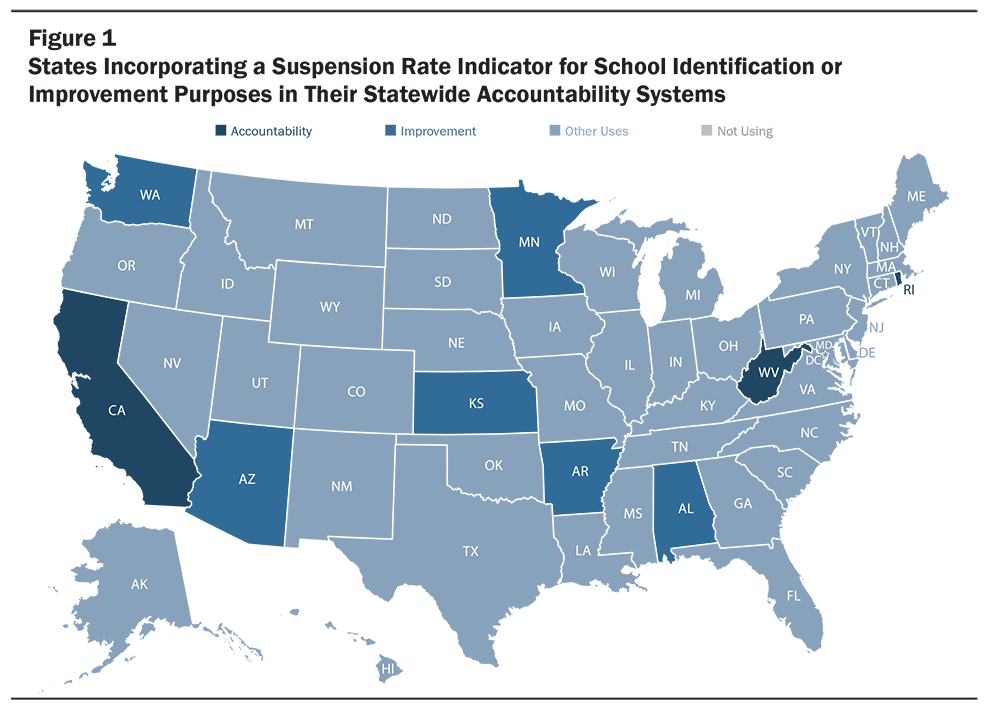
Under ESSA, all states are required to include rates of in-school and out-of-school suspensions, expulsions, school-related arrests, referrals to law enforcement, and incidences of school violence (including bullying and harassment) on their state and local report cards. In addition, nine states are including a measure of suspension in their statewide accountability and improvement systems either for school identification (three states) or improvement purposes in these identified schools (six states) (see Figure 1). Three of these states are also including a student expulsion measure for improvement purposes. An additional 20 states and the District of Columbia describe in their state plans how they are using suspension rate information within their broader system to inform continuous school improvement across all schools.
Use of this indicator is intended to incentivize approaches and interventions that improve student engagement in school rather than exclusion from school. For example, states often encourage districts and schools to replace zero-tolerance strategies with effective SEL programs and approaches such as restorative justice.
Selected State Approaches: California, Rhode Island, and West Virginia
California is using a suspension rate indicator in its accountability system to measure school quality for all k–12 students. The state establishes different sets of cut scores for elementary, middle, and high schools. Suspension calculations include both in-school and out-of-school suspensions in the numerator, and the denominator is determined by cumulative enrollment of all students enrolled at a school during the school year. California disaggregates the data at both the school and student-group level, and it compares yearly suspension rates to calculate annual changes. The state supports districts in reducing the overuse of discipline practices that remove students from the classroom by sharing online information on strategies and interventions, such as restorative justice programs and other practices that replace high-risk punitive discipline practices with positive interventions. Finally, California is providing Title I educators with technical assistance in the use of a multitiered system of supports to promote positive behavioral practices at the local level.
Rhode Island is using student suspension rates as part of its SQSS indicator. The suspension rate measures the number of out-of-school suspensions per 100 students, pre-k through grade 12. Rhode Island reports student suspensions annually for all student subgroups at the state and school level. A statewide repository called InfoWorks! allows users to compare schools on multiple related measures, including: (1) the types of infractions that resulted in suspensions, (2) the type of disciplinary response, (3) the relationship between the number of students enrolled and the number of suspensions, and (4) rates of suspensions per 100 students by race.
The Rhode Island Department of Education provides state-developed resources for schools to reduce the need for disciplinary actions, including suspension. These resources will be funded through competitive state grants using ESSA Title IV, Part A funds (Student Support and Academic Enrichment grants) and will include school-based mental health services, mentoring and school counseling, schoolwide positive behavioral interventions and supports, and programs to reduce exclusionary discipline practices. To identify and share models of best practices to improve school climate, the Rhode Island Department of Education supports a Community of Practice, which hosts open meetings three times a year that provide presentations and opportunities for discussions between educators and practitioners.
West Virginia measures disciplinary exclusions in its pre-k–12 accountability system as the percentage of students at each school who receive zero out-of-school suspensions within a school year, reflecting the state’s effort to promote the use of alternative responses that maximize student access to instruction. For example, the West Virginia Department of Education promotes non-exclusionary approaches to discipline, such as positive behavior programs, character education, peer mediation, conflict resolution, prevention of harassment, and responding to intimidation and substance abuse. West Virginia outlines recommendations to schools, such as responding to minor behavior violations with student conferences or changes in the student’s schedule rather than through the use of exclusionary practices. The state supports districts in using a tiered intervention approach that includes a comprehensive system of mental health services for students and provides training for educators in how to use both the state’s early warning system and a longitudinal data system that will allow educators to sort and filter data based on academics, attendance, behavior, and other available data. As a result, educators are able to make timely and actionable subgroup-specific decisions that reduce disparities between student groups.
Policy Considerations for Implementation
States and districts can improve the utility of their suspension indicator and help schools respond productively by:
- Eliminating zero-tolerance policies and the use of suspensions and expulsions for lower-level offenses, replacing them with supportive, inclusive, and effective strategies that address student misbehavior with alternatives that teach responsibility, including restorative justice programs that emphasize repairing the harm caused by problematic behavior.
- Establishing statewide systems of restorative justice programs to increase student access to and educator preparation for these programs.
- Creating data systems that provide schools with access to the information needed to assess patterns in rates of suspension or expulsion (e.g., specific classrooms, grade levels, times of year, etc.) and allow for timely intervention by school or district leadership. For example, if some schools suspend students around testing time to avoid including these students in their accountability metrics, the pattern would become apparent and could be flagged for attention by district leaders.
- Providing both schoolwide professional development for teachers and targeted coaching based on classroom-level data. Because research indicates that there is a relationship between a high suspension rate and a higher-than-average number of novice teachers or those without preparation, such training might be particularly focused on educators in their early careers.
- Providing training on implicit bias and asset-based youth development for teachers, administrators, school resource officers, police, juvenile judges, and others working with children and youth.
- Tracking multiple suspensions for individual students; the average length of suspensions; and the number of in-school and out-of-school suspensions so that the state, district, and school will have an accurate picture of the extent to which students are losing instructional time and can explore the impact of any interventions on individual students as a basis for problem solving for those students and for the system.
While building productive alternatives, it is also important for states and districts to avoid counterproductive alternatives by, for example:
- Prohibiting the use of corporal punishment in public schools—which is used disproportionately with African American students—in the 19 states that still allow it.
- Eliminating referrals to law enforcement for all nonviolent, noncriminal offenses by developing model school discipline policy and agreements that clarify the distinction between educator and law-enforcement discipline.
Resources on Suspension and Expulsion Rates
- School Discipline Organizations and Resources (American Association of School Administrators and the Children’s Defense Fund)
This resource provides an overview of organizations and resources that provide focused supports relating to improving discipline. - Meaningful Local Engagement Under ESSA: A Handbook for LEA and School Leaders (Council of Chief State School Officers and Partners for Each and Every Child)
This handbook offers several resources for policies that remove police from schools, replacing them with effective staff-led strategies for classroom management, conflict resolution, and mediation. - Locked Out of the Classroom: How Implicit Bias Contributes to Disparities in School Discipline (NAACP Legal Defense Fund)
This report examines how disparities in school discipline result from implicit bias and perpetuate stereotypes and provides interventions to help improve relationships between teachers and students. - Understanding Implicit Bias: What Educators Should Know (American Federation of Teachers)
This article describes the importance of addressing implicit bias in education, how unconscious attitudes can affect disciplinary decisions, and how teachers can mitigate the effects of implicit bias. - Supporting and Responding to Behavior: Evidence-Based Classroom Strategies for Teachers (U.S. Office of Special Education Programs)
This document summarizes evidence-based, positive, proactive, and responsive classroom behavior intervention and support strategies for teachers.
To see a state-by-state summary on how states are using a Suspension Rate indicator, see page 7 of this downloadable brief or explore this interactive map for individual state information.
Reducing Student Suspension Rates: Making ESSA’s Equity Promise Real: State Strategies to Close the Opportunity Gap by Stephen Kostyo, Jessica Cardichon, and Linda Darling-Hammond is licensed under a Creative Commons Attribution-NonCommercial 4.0 International License.
This research was supported by a grant from the Ford Foundation. LPI’s work in this area is also supported by the S. D. Bechtel, Jr. Foundation; the William & Flora Hewlett Foundation; and the Sandler Foundation.