Implementing an Extended-Year Graduation Rate

Summary
This policy brief is part of a larger research report, Making ESSA’s Equity Promise Real: State Strategies to Close the Opportunity Gap, that describes how states are using opportunities in ESSA to better support historically underserved students through the thoughtful selection of specific equity measures in their accountability and improvement systems. To this end, the full report suggests focusing attention on students furthest from opportunity by taking steps to
- reduce rates of student suspension;
- build a positive school climate;
- reduce rates of chronic absenteeism;
- implement an extended-year graduation rate; and
- expand access to a college- and career-ready curriculum.
This brief focuses on state efforts to implement an extended-year graduation rate. For the full report, go here.
Introduction
The Every Student Succeeds Act (ESSA), passed in December 2015, gives states the opportunity to create new approaches to school accountability and continuous improvement. These approaches, if informed by well-chosen indicators of school opportunity and performance, have the potential to create more inclusive and equitable learning environments for historically underserved students.
Along with measures of academic achievement (student performance on state assessments in English language arts and mathematics, which may include growth in proficiency), graduation rates, and English language proficiency, ESSA requires states to include at least one indicator of school quality or student success (SQSS).
All indicators must provide valid, reliable, and comparable information within each state’s accountability system. States then use school performance on these indicators to identify schools for either comprehensive support and improvement or targeted support and improvement. Districts with such schools can use data from statewide indicators to inform the needs assessments and school improvement plans required under ESSA. States can also select additional indicators to use as part of their broader continuous school improvement efforts across all schools, regardless of identification status.
Now that all states have received approval from the U.S. Department of Education for their plans for statewide accountability and improvement systems, a number of states are taking advantage of the opportunities provided by ESSA to measure the extent to which their students are supported and provided with equitable educational opportunities.
This brief specifies which states are implementing extended-year graduation rates in their ESSA plans and describes how some states intend to measure and use information from this indicator to create more equitable and inclusive learning environments for all students.
Implementing an Extended-Year Graduation Rate
Since the passage of the No Child Left Behind Act of 2001, federal accountability has focused on the 4-year adjusted cohort graduation rate. While this approach has provided a much-needed common measure of graduation, when used in an accountability system, it removes incentives and recognition for schools to keep working with struggling youth to help them graduate in 5 or 6 years. For a variety of reasons it is extremely challenging for some students to graduate in 4 years. Those reasons may include everything from incarceration, health issues, pregnancy, and employment necessary for subsistence to missing credits for those with educational gaps, those with special needs, or those who have immigrated with little prior education. Because students who are unable to graduate on time are often low-achieving, there is little incentive to keep them in school, because they depress both achievement and graduation rate indicators when only a 4-year graduation rate is used.
Given that 1 in 5 students does not graduate within 4 years (with much higher proportions in high-need communities), incentives are needed to recognize the efforts of schools that continue to work with these students through successful graduation. Effective practices for increasing graduation rates focus on
- extra academic supports for students who have greater educational needs;
- social services and other wraparound supports for students whose needs extend beyond the academic;
- curriculum, instruction, and assessments designed to help students engage in the learning process and fill gaps in their prior learning experiences while they develop analytic, collaboration, and communication skills;
- formative assessments that enable teachers to understand how and what students are learning so they can support student mastery of content, skills, and dispositions;
- school structures that support personalization and connections to adults within the school and the community outside of school;
- teachers working together to focus on students’ strengths, interests, and needs; to engage in their own learning; and to collaborate on the improvement of their instructional practices; and
- leadership that is shared, with a focus on incorporating the voices of students, teachers, staff, administrators, and parents in key decisions meant to support student success.
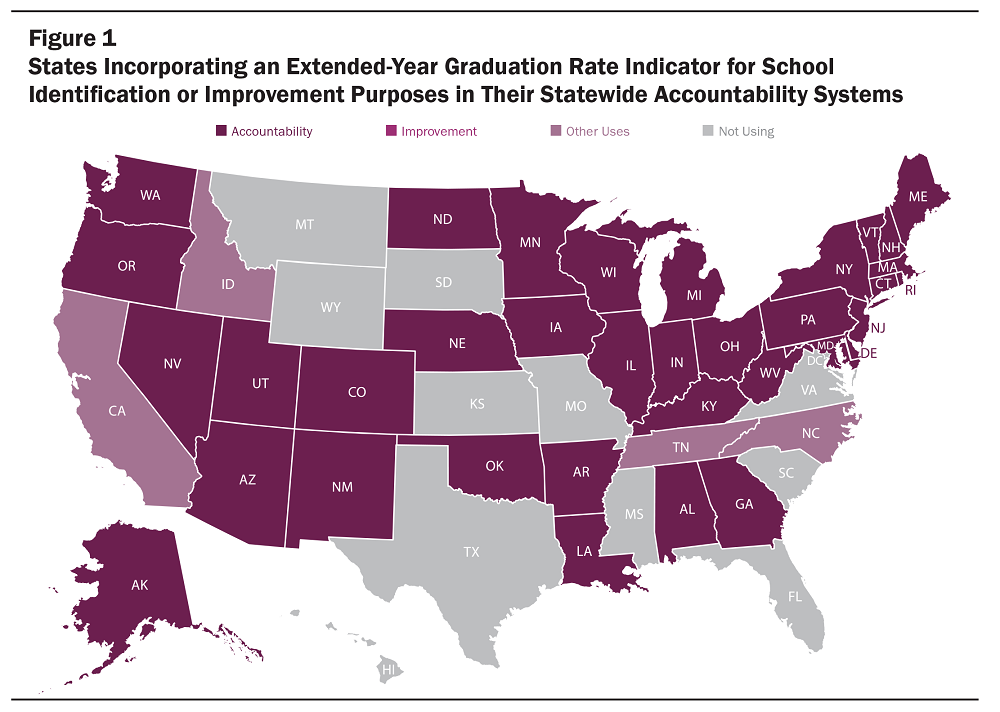
ESSA creates opportunities for states to include increased support for students who are unlikely to graduate in 4 years. Currently, 35 states include extended-year graduation rates in their accountability and improvement systems (see Figure 1). Sixteen of these states are measuring a 5-year graduation rate only, and 19 states use a 6- or 7-year graduation rate (sometimes in addition to the 4- or 5-year rate). Two additional states are reporting a 5-year graduation rate and two other states are in the process of developing or piloting a 5-year graduation rate, which will be incorporated into their accountability and improvement system in the 2019–20 school year.
Selected State Approaches: Illinois, New Jersey, and New Mexico
Illinois incorporated an extended-year graduation data into its accountability system in 2012. These data are collected consistently across all local education agencies (LEAs) serving high school students. The state’s goal, by 2032, is to have 90% of its students graduate college- and career-ready in 4 years, 92% in 5 years, and 92.5% in 6 years. The Illinois State Board of Education evaluates state-level data to identify the groups of students most unlikely to meet the 4-year graduation requirements to determine its extended-year cohorts and will continue to convene a Technical Advisory Council to make amendments to the state ESSA plan as additional data become available.
Schools that struggle to achieve their graduation goals, especially schools identified for CSI or TSI, have access to the statewide system of support, IL-EMPOWER, which helps schools participate in a needs analysis to identify improvement targets in one or more of the following areas: Governance and Management, Curriculum and Instruction, and Climate and Culture. Once schools identify where they need support, an IL-EMPOWER-approved partner connects with them to implement strategies to meet school-identified targets. Possible strategies focus on capacity building with an emphasis on data competency, resource management, developing leadership, cultural awareness, communication strategies, professional learning communities, universal design for learning, and social-emotional learning (SEL).
New Jersey includes in the graduation rate indicator the percentage of students who graduate within 5 years of entering 9th grade. The state tracks 4- and 5-year graduation rates, with the statewide goal of having 95% of its students graduate within 4 years and 96% within 5 years by 2030, with the same long-term goal for every subgroup. In its school performance reports, the New Jersey Department of Education currently tracks 4-year and extended-year graduation rates for high schools separately, and it will continue this practice while also investigating the feasibility of using an extended-year graduation rate of 6 or 7 years as part of its continuous improvement process. The Department uses both 4- and 5-year graduation rates to calculate an overall combined graduation rate for schools. It is important to note that as New Jersey set these new graduation goals, it also increased the rigor of its graduation requirements. These new requirements may require the state to set updated graduation baselines and targets for students as part of the state’s continuous improvement process.
New Mexico tracks 4-, 5-, and 6-year graduation rates, with the statewide goal, by 2022, of having 85% of its students graduate in 4 years, 88% in 5 years, and 90% in 6 years. For school identification purposes, the 4-year graduation rate has more influence on a school’s overall rating than the 5- and 6-year rates, although the extended-year weights are factored into the rating. The state’s intent is to place primacy on graduating students in the standard number of years while also recognizing students who graduate in 5 or 6 years. New Mexico also uses multiple years of graduation rate data to calculate growth in the 4-year graduation rate. This indicator of growth in graduation rates counts as an SQSS indicator within the accountability system. New Mexico supports its graduation goals with programs to increase parental engagement; the creation of individualized Next Step Plans for each student, beginning at age 12; and priority placement in classes that meet graduation requirements for students experiencing disruptions in education.
Policy Considerations for Implementation
States and districts can improve graduation rates by:
- Focusing on supporting the needs of the whole student. All students, and high-need students in particular, can benefit from integrated student supports that offer health care, mental health resources, and other social services, as well as after-school supports, mentoring, and tutoring—all of which can make a difference in graduation rates. A community school approach that incorporates these elements has been shown to increase graduation rates in many settings.
- Reducing suspension rates through investments in SEL and restorative practices. High rates of suspension increase the likelihood of students dropping out of high school.
- Creating advisory systems and small schools or small learning communities within larger schools that allow students to be well known. These approaches have been found to support higher graduation rates.
- Focusing on 9th-grade success, which strongly predicts graduation rates, by offering summer transition programs, identifying students at risk of falling behind in credits to ensure appropriate interventions, and providing additional supports for academic success.
- Utilizing data systems to effectively track whether students are making the transition from middle school to high school. While creating a more accurate picture of graduation rates, this can also trigger efforts to find and enroll the sometimes sizable number of students who otherwise fail to enroll in high school and discover how to meet their needs. These data can also help districts identify whether additional supports may be needed for some groups of students during the transition from middle school to high school.
States can also more accurately track graduation rates by creating transparent and consistent practices. These include, for example, clarifying that LEAs must:
- Ensure that student enrollment in each school’s 9th-grade cohort is counted no later than October 1 of the school year. ESSA requires that the determination of cohort membership be no later than the date by which student data must be collected annually by the state for submission to the National Center for Education Statistics under the Education Sciences Reform Act. This date is October 1 and is not often known to LEAs.
- Obtain the written documentation necessary to remove students from their graduating cohort.
- Exclude students receiving a General Education Development (GED) certificate from graduation rate calculations, as required by ESSA.
Resources on Extended-Year Graduation Rates
- Preventable Failure: Improvements in Long-Term Outcomes When High Schools Focused on the Ninth Grade Year (The University of Chicago Consortium on Chicago School Research)
This report describes additional strategies to support on-track graduation efforts during the pivotal transition from middle school to high school. - 2018 Building a Grad Nation: Progress and Challenge in Raising High School Graduation Rates (The Everyone Graduates Center)
This is the most recent update of the Everyone Graduates Center’s campaign to raise high school graduation rates. - Community Schools: An Evidence-Based Strategy for Equitable School Improvement (Learning Policy Institute)
This report provides guidance to school, district, and state leaders as they consider, propose, or implement a community school intervention in schools targeted for comprehensive support. - Transforming the High School Experience: How New York City’s New Small Schools Are Boosting Student Achievement and Graduation Rates (MDRC)
This report describes how a large system of small public high schools can be created and can markedly improve graduation prospects for many disadvantaged students. - CASEL Program Guides: Effective Social and Emotional Learning Programs (Collaborative for Academic, Social, and Emotional Learning)
The CASEL Guide provides a systematic framework for evaluating the quality of social and emotional programs and shares best-practice guidelines for district and school teams on how to select and implement SEL programs. Finally, it offers recommendations for future priorities to advance SEL research and practice.
To see a state-by-state summary on how states are using an Extended-Year Graduation Rates indicator, see page 7 of this downloadable brief or explore this interactive map for individual state information.
Implementing an Extended-Year Graduation Rate: Making ESSA’s Equity Promise Real: State Strategies to Close the Opportunity Gap by Stephen Kostyo, Jessica Cardichon, and Linda Darling-Hammond is licensed under a Creative Commons Attribution-NonCommercial 4.0 International License.
This research was supported by a grant from the Ford Foundation. LPI’s work in this area is also supported by the S. D. Bechtel, Jr. Foundation; the William & Flora Hewlett Foundation; and the Sandler Foundation.