Identifying Schools for Support and Intervention: Using Decision Rules to Support Accountability and Improvement Under ESSA

Summary
Under the Every Student Succeeds Act, states are using a new approach to accountability based on multiple indicators of educational opportunity and performance. States have the opportunity to decide how to use them to identify schools for intervention and support and to encourage systems of continuous improvement across all schools. When identifying schools, states may consider an index of measures that produces a single summative score or a set of decision rules. In some cases, a decision rule approach can encourage greater attention to each of the measures, offer more transparency about how school performance factors into identification, and support more strategic interventions than those informed only by a single rating, ranking, or grade.
This brief describes five options designed to meet ESSA’s requirements and support states in effectively identifying such schools for support and intervention.
One of the many changes created by the Every Student Succeeds Act (ESSA) is the shift from the previous law’s framework, which relied on mathematics and reading test scores to define a school’s success or failure, to a new approach that measures school quality based on a combination of at least five measures. These measures include:
- English language arts performance
- Mathematics performance
- English language proficiency gains for English learners
- Graduation rates for high schools and an alternative academic indicator for elementary and middle schools (e.g., a growth measure or another area of performance, such as science or history)
- At least one indicator of “school quality or student success” (SQSS), which might include one or more measures, such as chronic absenteeism, school climate, suspension rates, opportunities to learn, or college and career readiness, for example.
Using these indicators, the state accountability system must include an approach to identify at least the bottom 5% of Title I funded schools in need of support based on low overall performance (for comprehensive support and intervention) or consistent underperformance of a student group (for targeted support and intervention). States must also identify any high school with a 4-year adjusted cohort graduation rate at or below 67% for comprehensive support and intervention (CSI). Just as important as which indicators a state selects for this framework is how a state will use these indicators to identify schools for intervention and support and to encourage continuous improvement across all schools for all students.
ESSA allows states flexibility in how they combine and use these indicators to identify the appropriate schools for support and improvement. While states may consider an index of measures that produces a single summative score, a state could also use a set of decision rules to meet the law’s requirements. Depending on how it is constructed, a decision rule approach can encourage greater attention to the full dashboard of measures, offer more transparency about how school performance factors into identification, and support more strategic interventions than those informed only by a single rating, ranking, or grade.
The importance of what approach a state takes in using the system’s indicators to identify schools should not be underestimated. Different approaches will identify different schools, even when using the same set of indicators. While summative scores determined by an index can be simple to create and understand, they could fail to identify schools with acute levels of low performance on particular indicators that get masked when rolled into a single rating. Decision rules, in contrast, can more systematically set minimum performance thresholds that a state deems acceptable or ensure that certain prioritized indicators are always taken into account.
Ideally, a state’s approach to school identification for support should:
- make sure all indicators count in the system while also meeting the requirements of ESSA regarding the weight of academic indicators;
- include progress along with performance;
- ensure that the rules do not overtax the system's ability to support improvements by identifying too many schools;
- avoid overlooking schools by masking subgroup performance or performance on individual indicators and overlooking schools; and
- be transparent in terms of performance overall, on individual indicators, and by subgroups of students.
Initial Considerations When Designing Decision Rules
ESSA requires that, together, the set of academic measures must have “much greater weight” than other nonacademic measures in making determinations and that each of these individual academic indicators must have “substantial weight.” Each of the following options attempts to afford greater weight to academic indicators, but ultimately, stakeholders in each state and the U.S. Department of Education must ensure that the state’s final framework meets the standard set under the law.
A state’s context, including the number and kind of indicators it is using for accountability, is also important for determining which set of decision rules is most appropriate. States might take the following into account:
- How many academic and SQSS indicators does the state have? If there are as many (or more) indicators of SQSS as there are academic indicators, the state may need to adjust the decision rules to allow for greater weight to academic indicators to comply with ESSA.
- How will decision rules need to be different for different grade spans that have different sets of indicators? For example, how will decision rules for a high school need to be different from an elementary school that does not have graduation rates or a College- and Career-Ready indicator?
- Is there a growth measure for any or all of the indicators, and if so, how will it be taken into consideration? States may factor growth or improvement along with status into a school’s performance on one or more indicators, or they may consider growth or progress as an indicator on its own.
Options for Using Decision Rules to Identify Schools for Comprehensive Support and Intervention
There are many ways that decision rules can be used to identify schools in need of support. This section describes five options (all designed to meet ESSA’s requirements):
- Identify schools with the lowest performance on the greatest number of indicators. If academic indicators outnumber nonacademic indicators, they will automatically have greater weight.
- Weight academic indicators more heavily, and then identify schools with the lowest performance on the greatest number of indicators. This may be necessary if there are many nonacademic indicators to ensure that academic indicators carry greater weight.
- Identify schools with the lowest average score on the full set of indicators (which may be weighted or unweighted), taking their level of performance into account.
- Identify schools that have the lowest performance on any indicator, and support those schools to improve in that domain.
- Consider each indicator in a progressive selection process.
Examples of Decision Rules
To illustrate these decision rules, we have constructed examples based on a hypothetical state that has chosen the following indicators for its accountability and improvement system:
- English Language Arts (ELA) as measured by achievement on an annual assessment;
- Mathematics as measured by achievement on an annual assessment;
- Graduation Rate as measured by the 4-year, 5-year, and 6-year adjusted cohort graduation rates;
- English Learner Progress as measured by gains in English language proficiency;
- Chronic Absenteeism as measured by the percentage of students absent 10% or more of their time enrolled at the school; and
- College and Career Readiness as measured by student participation, performance, and completion of advanced placement coursework.
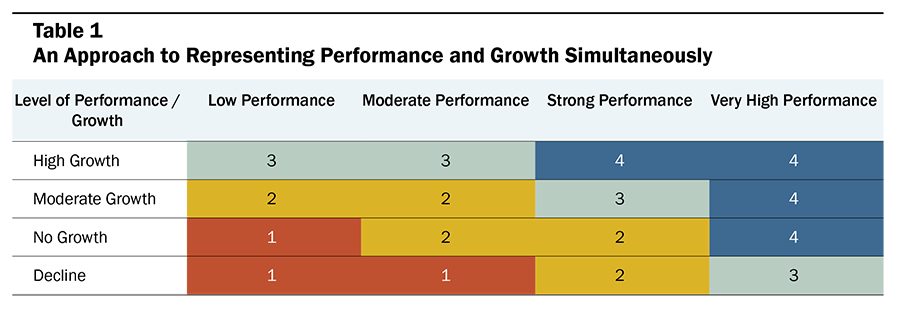
Under ESSA, Indicators 1 through 4 must be afforded substantial weight individually and, in the aggregate, much greater weight than is afforded to Indicators 5 and 6. In this hypothetical state, school performance is rated on a scale from 1 to 4, with 4 representing high performance, taking both status and growth into account, as shown in Table 1.
Option 1: Identify schools with the lowest performance on the greatest number of indicators
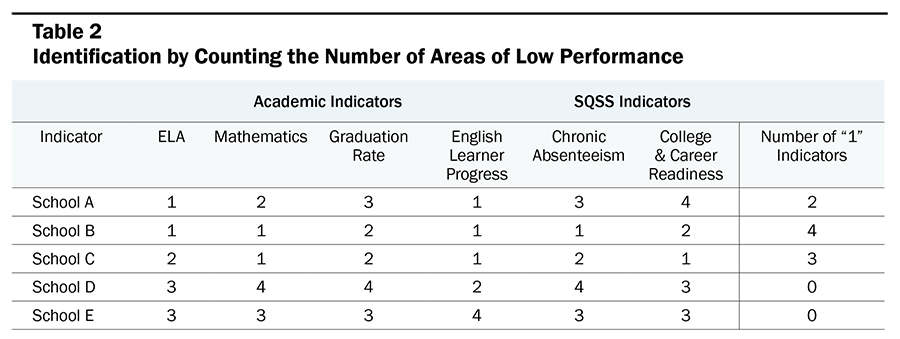
One of the simplest ways to use decision rules is to look at schools’ performance level on all applicable indicators, with ELA and mathematics achievement as separate indicators. The state would initially identify those with the greatest number of low ratings, for example, a “1” out of 4 possible levels, among the academic indicators.
This method weights all indicators equally. In the example given in Table 2, academic indicators comprise four of the six indicators and are thus more heavily weighted. This option will only give greater weight to academics if the state has more academic than SQSS indicators.
The example in Table 2 shows a set of five high schools, each receiving a rating based on a scale of 1 to 4, based on performance and growth on that indicator. School B would be identified for CSI first since it has the greatest number of “1s.” If the state were to identify more schools (e.g., because it had not yet identified 5% of all schools), School C would be identified next.
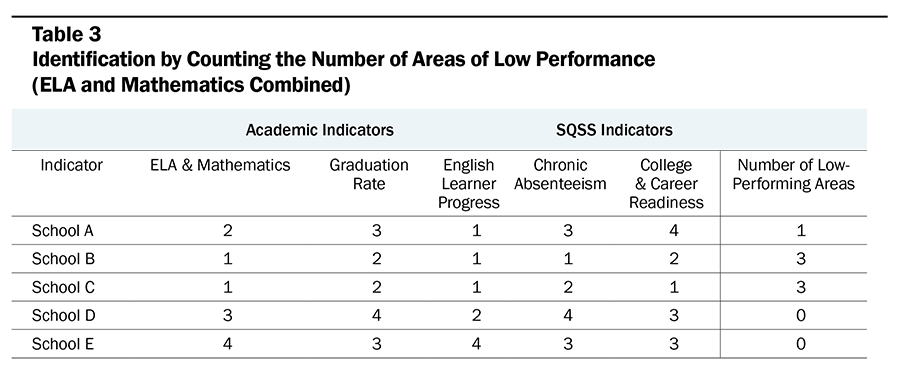
Variation on Option 1: Combine ELA and Mathematics into a single academic indicator
States might also combine their ELA and Mathematics indicators into a single indicator (see Table 3). In this case, academic indicators would comprise three of the five indicators and are thus still more heavily weighted than SQSS indicators, but perhaps not “much” more. In this scenario, Schools B and C would be identified first, and, depending upon whether the minimum threshold for identification—5% of schools—was met, the state could then identify School A.
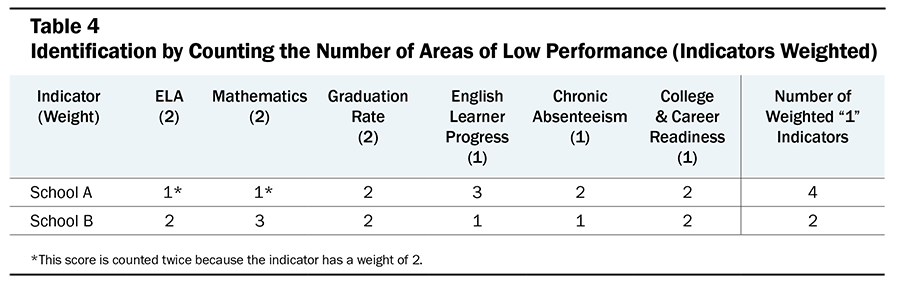
Option 2: Identify schools with the greatest number of low-performing indicators, but give certain academic indicators greater weight
Another option, similar to Option 1, is to look at performance levels on all applicable indicators but weight certain indicators more or less than others (see Table 4). Each “1,” the lowest score possible, would earn a school a point—and if an indicator has a weight of 2, it would count as an additional “1.” This option can ensure “much greater weight” for academic indicators.
In the example below, both schools A and B earned a “1” on two different indicators. However, since ELA and Mathematics are both weighted more heavily, School A receives four points, while School B receives two. School A would thus be identified for intervention first.
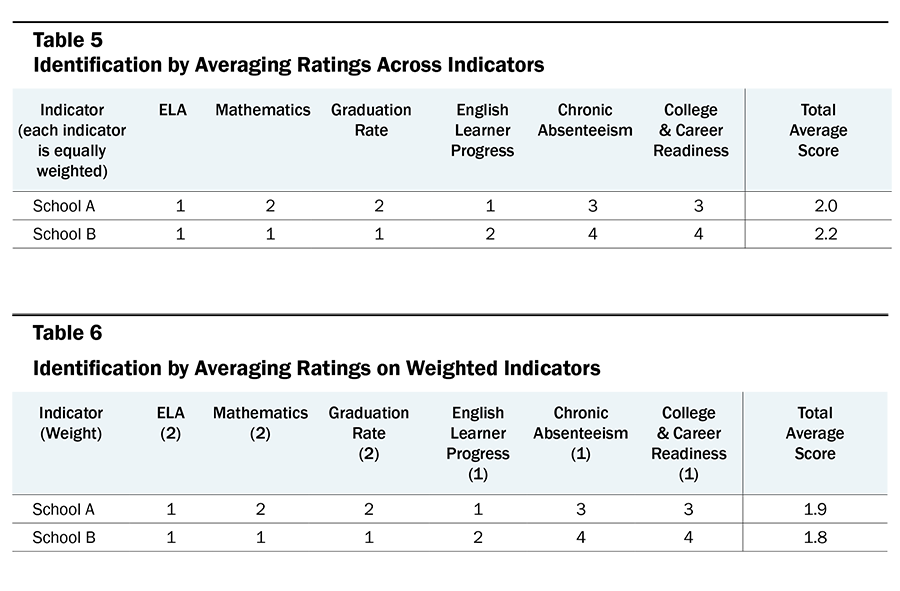
Option 3: Identify schools with the lowest average score
Another option is to look at performance levels on all applicable indicators, identifying schools with the lowest average score. In this approach, the school’s performance level on each indicator is taken into account, unlike in options 1 and 2, in which only scores of “1,” the lowest possible score, were taken into consideration. Indicators could also be weighted more or less than others (as in Table 6) and in this way ensure “much greater weight” for academic indicators.
In Table 5, School B earned an average score of 2.2. In Table 6, the average score for School B was lower—1.8—because the academic indicator and graduation rates were weighted more heavily. The state would rank each school by its average score and then identify the lowest 5% percent of schools based on that average.
While School B outperforms School A in Table 5, this higher rating masks the fact that it performs more poorly on Mathematics as well as Graduation Rate. School B’s average drops substantially when academic indicators are weighted as in Table 6, making it more likely than School A to be identified with weighted indicators, although it outscored School A initially. Thus, different approaches result in different schools being identified.
Option 4: Identify schools with very low performance on any indicator for support and intervention
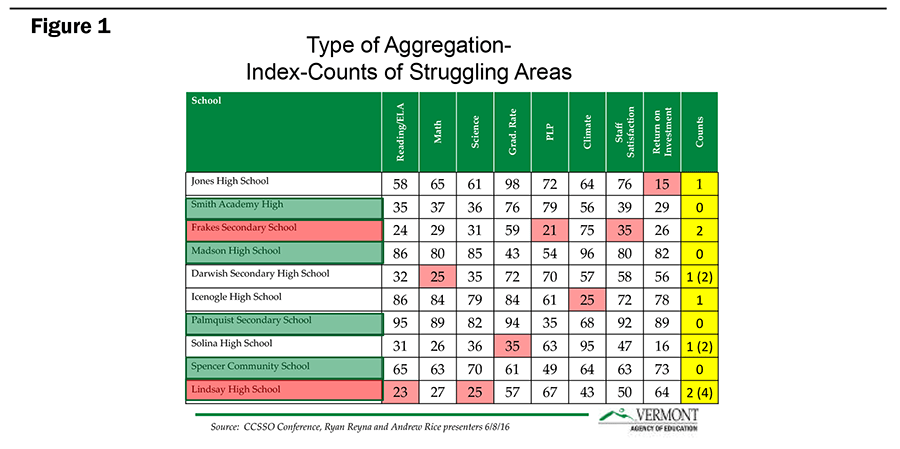
States could identify schools that are low-performing and not improving (or that have large, persistent equity gaps) on any single indicator, and provide focused intensive assistance to those schools to really help them improve in that area. The state might identify the neediest schools in each indicator area for intensive intervention. The total number of schools assisted might be designed to equal 5% or might exceed that number, depending on where the bar is set, but each could receive help for the specific areas of need. Across the set of indicators, some schools will be low-performing in several areas and could receive more comprehensive services and supports.
For example, a state could identify the bottom 3% of schools on each indicator and require that they participate in school improvement strategies to address each area of low and non-improving performance, while also allowing other schools to voluntarily engage in those improvement supports if they are doing better than the lowest-performing schools but still not well. As an illustration, the state could identify and work with a group of schools that are not making sufficient progress in supporting English language proficiency gains by organizing research about what works, examples of local schools that have strongly improved and can be visited and studied, curriculum materials and program models that can be adopted, professional development for educators, and coaches who work directly in the schools. The same thing could be done with schools that are struggling in mathematics performance, for example, or graduation rates, or high suspension rates, overall or for specific groups of students.
In the hypothetical example in Figure 1, Frakes and Lindsay high schools might be required by the state to join a professional network focused on improving literacy instruction, in which Smith and Jones also participate voluntarily. Meanwhile, Darwish, Solina, and Lindsay might be required to join a professional development network to improve their mathematics instruction, in which a number of other schools, including Spencer, participate at their own option.
Just as targeted interventions can be organized for students who are struggling in a particular area, so can such interventions be organized to support networks of schools that share a common need. Research has demonstrated the power of targeted interventions for networks of schools that share similar goals.
Option 5: Consider each indicator in a progressive selection process
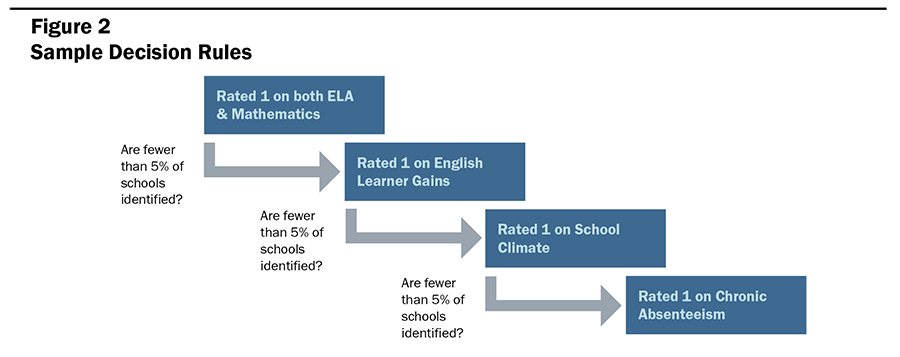
The final option uses an elementary school as an example and is based on the following indicators: ELA and Mathematics performance and growth, English Learner gains, School Climate, and Chronic Absenteeism. This option would establish an initial pool of schools eligible for identification by counting the number that received the lowest possible score, a “1” (low-performing and/or non-improving), on certain indicators. If not enough schools were identified in that initial pool, schools that received a “1” on other indicators would then be considered for identification. In the sample approach to a set of decision rules in Figure 2, the state would proceed as follows:
- Identify schools that received two "1s" on ELA and Mathematics. If too few schools (e.g., less than 5%) identified, then
- Additionally identify schools receiving a "1" on English Learner proficiency gains. If too few schools identified, then
- Additionally identify schools that received a "1" on College and Career Readiness. If too few schools still identified, then
- Additionally identify schools that received a "1" on Chronic Absenteeism (and so on).
Using a progressive selection process may result in some indicators not contributing to CSI identification in a given year, if 5% of schools are identified before these indicators come into play. Thus, this option is potentially less desirable if a state wants to ensure that all of the indicators count in the identification process each year.
Another way to use progressive decision rules would be to use counts of indicators after the first stage or two. So, for example, after selecting all schools rated a “1” on ELA and mathematics, one might choose, in order, additional schools that have three “1s” on the other three indicators; those that have two “1s”; and those that have one “1.”
Conclusion
This brief has shown how different kinds of decision rules might be used to identify schools in need of support under ESSA. The methodology that states use to identify schools is important because different schools may be identified under different approaches. When choosing a methodology, states should consider their local context to maximize the chance that all indicators are given appropriate weight and a reasonable and required number of schools is identified, while maintaining transparency and avoiding masking performance of individual indicators or subgroups. Just as important as which indicators a state selects for this framework is how a state will use these indicators to identify schools for intervention and support and to drive continuous improvement across all schools for all students.
Identifying Schools for Support and Intervention: Using Decision Rules to Support Accountability and Improvement Under ESSA (policy brief) by Linda Darling-Hammond, Jessica Cardichon, and Hanna Melnick is licensed under a Creative Commons Attribution-NonCommercial 4.0 International License.
LPI’s work in this area has been supported by grants from the S. D. Bechtel, Jr. Foundation, the Ford Foundation, and the Hewlett Foundation. General support has been provided by the Sandler Foundation.