
Summary
California recently committed to making prekindergarten (PreK) universal through the expansion of transitional kindergarten (TK) and other state-funded programs. Between 2021–22 and 2023–24, TK enrollment doubled, from about 75,000 to over 151,000 children. Approximately 59% of eligible 4-year-olds enrolled in TK in 2023–24. Across publicly funded PreK programs—TK, the California State Preschool Program, and Head Start—California went from serving about 34% of all 4-year-olds to 50% between 2019–20 and 2023–24. Enrollment of 4-year-olds climbed from about 37% to 55% during that time when also considering subsidized child care. These data are promising both in absolute terms and relative to trends in other states, although more information is needed to understand whether programs are high quality and access is equitable.
Introduction
California began a major expansion of PreK in 2021, part of the state’s Universal Prekindergarten initiative. One important investment was expanding state funding for TK, a school-based PreK program, to all 4-year-olds by 2025–26. At the same time, the legislature committed to maintaining other federally and state-funded PreK options for income-eligible families, including the California State Preschool Program (CSPP) and Head Start, as well as subsidized child care. This brief examines the impact of these substantial investments by calculating how many eligible children have enrolled to date.
How Many Children Have Enrolled in Transitional Kindergarten?
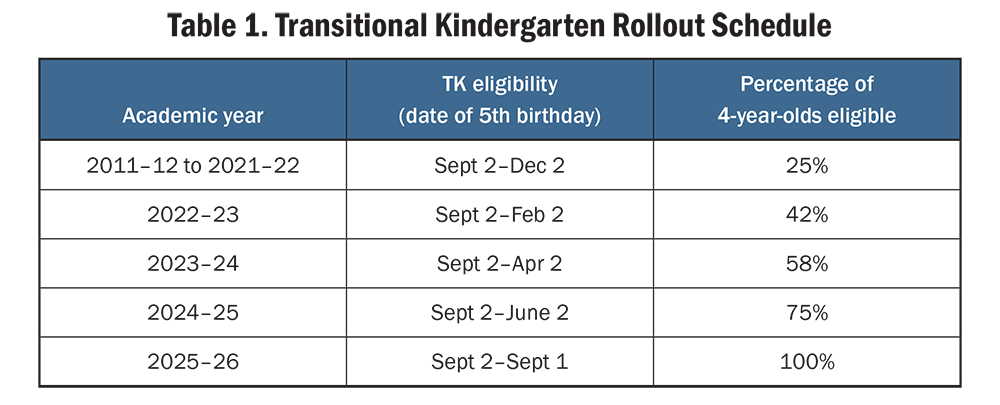
TK enrollment has increased substantially in recent years. When TK was created in 2010, TK eligibility was limited to older 4-year-olds with birthdays between September 2 and December 2. Starting in the 2022–23 school year, eligibility was expanded by adding months of birthdays each year until all 4-year-olds were eligible in 2025–26. (See Table 1.)
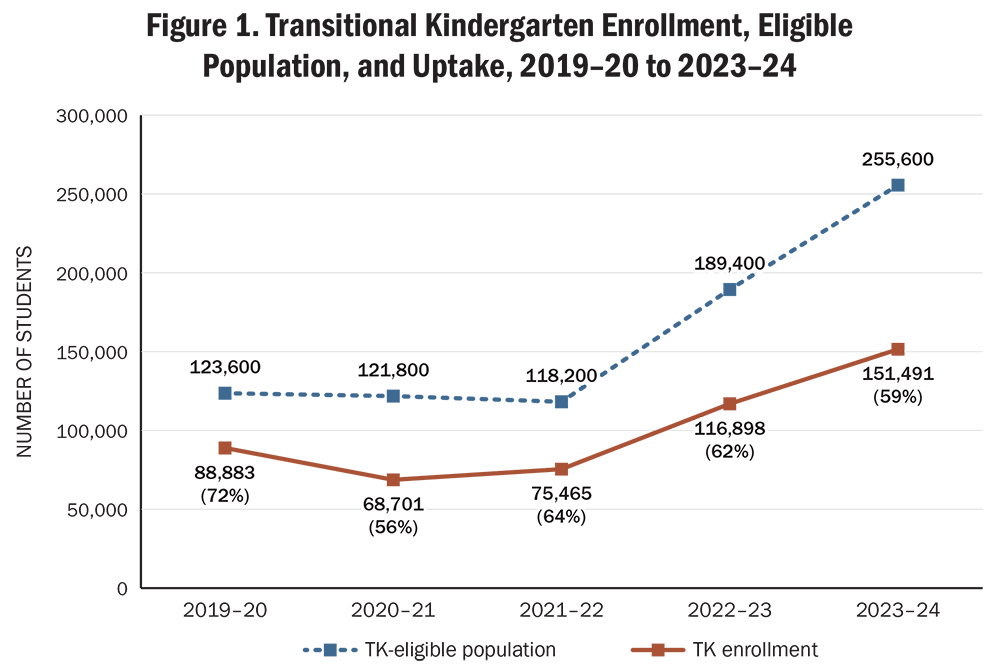
As shown in Figure 1, in 2019–20, 88,883 children enrolled in TK, comprising 72% of 4-year-olds who were eligible that year.The total 4-year-old population estimates are based on the average number of individuals ages 4 and 5 each year. We derived the number of children eligible for TK from estimates of the total 4-year-old population in the state, multiplied by the fraction of children who are age-eligible for the program. Population data are estimates rounded to the nearest 100. TK enrollment data are publicly available from the California Department of Education. Transitional kindergarten data from 2019–20 to 2023–24. https://dq.cde.ca.gov/dataquest/. California’s estimated 4-year-old population data are obtained from United States Census Bureau. (2024, June 25). State population by characteristics: 2020–2023. U.S. Census’ annual estimates of the resident population by single year of age and sex for California: April 1, 2020 to July 1, 2023. [Data set SC-EST2023-SYASEX, 2020 to 2023]. https://www.census.gov/data/datasets/time-series/demo/popest/2020s-state-detail.html (accessed 07/15/24); United States Census Bureau. (2021, October 8). State population by characteristics: 2010–2019. Annual estimates of the resident population by single year of age and sex for California: April 1, 2010 to July 1, 2019. [Data set SC-EST2019-SYASEX-06, 2019]. https://www.census.gov/data/tables/time-series/demo/popest/2010s-state-detail.html (accessed 05/22/2024). In 2020–21, the first year of the COVID-19 pandemic, enrollment dropped to 68,701, or 56% of the eligible population. Enrollment rebounded slightly the following year, to 75,465, or 64% of the eligible population, although enrollment remained below pre-pandemic levels.
Enrollment in TK has doubled in the 2 years since 2021–22, influenced by the fact that more children are becoming eligible. In 2022–23, 116,898 children enrolled in TK (62% of the eligible population). By 2023–24, enrollment rose to 151,491 (59% of the eligible population). Total TK enrollment will likely continue to increase in upcoming years as the number of eligible children grows.
While the numbers of TK enrollees has risen, the proportion of eligible 4-year-olds enrolled in TK (the uptake rate) has declined over the past 2 years. This is because the number of eligible children has increased more rapidly than the number of additional children enrolling. Still, TK uptake is within the range of other states offering universal PreK, including Florida, Iowa, Oklahoma, Vermont, West Virginia, and Wisconsin. Pre-pandemic, these states served between 66% and 76% of eligible 4-year-olds in their state, while California served 72% of those eligible for TK. In the years after the COVID-19 pandemic, PreK enrollment declined in each of these states except for Iowa, with uptake ranging from 63% to 67% of the eligible population in 2022–23.We use the National Institute for Early Education Research’s definition of “universal preschool”: states that had universal preschool eligibility for 4-year-olds and served at least 60% of the population. This definition excludes states that have universal eligibility but restrict access due to limited funding. Between 2019–20 and 2022–23, Florida went from serving 72% to 67%; Iowa from 66% to 67%; Oklahoma from 70% to 67%; Vermont from 76% to 64%; West Virginia from 68% to 67%; and Wisconsin from 72% to 63%. Florida’s PreK program is the most similar in size to California’s, serving over 154,000 4-year-olds in 2022–23. Friedman-Krauss, A. H., Barnett, W. S., Hodges, K. S., Garver, K. A., Merriman, T., … Duer, J. K. (2024). The state of preschool 2023: State preschool yearbook. National Institute for Early Education Research; Friedman-Krauss, A. H., Barnett, W. S., Garver, K. A., Hodges, K. S., Weisenfeld, G. G., & Gardiner, B. A. (2021). The state of preschool 2020: State preschool yearbook. National Institute for Early Education Research. During that same year, enrollment in California’s TK program was 62% of eligible children, aligning with trends in other states.
Sources: California Education Code § 48000 (2021); California Department of Education. Transitional kindergarten data from 2019–20 to 2023–24; United States Census Bureau. (2024). State population by characteristics: 2020–2023. U.S. Census annual estimates of the resident population by single year of age and sex for California: April 1, 2020 to July 1, 2023; United States Census Bureau. (2021). State population by characteristics: 2010–2019. Annual estimates of the resident population by single year of age and sex for California: April 1, 2010 to July 1, 2019.
How Many 4-Year-Olds Have Enrolled in California’s Other Publicly Funded PreK Programs?
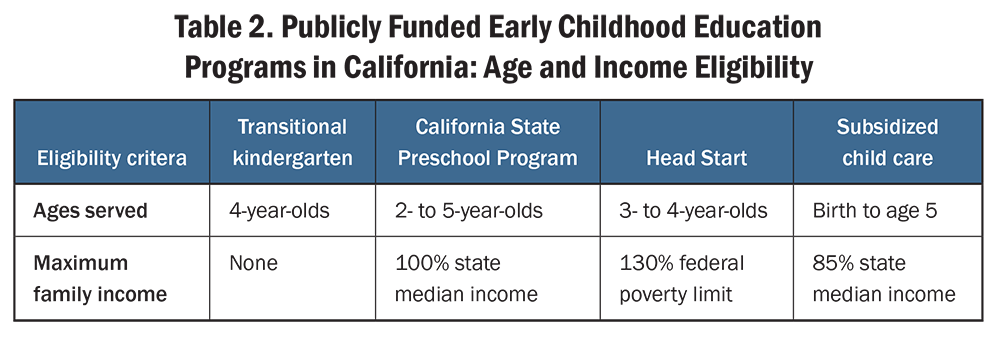
Since California’s Universal Prekindergarten initiative includes multiple state- and federally-funded preschool programs, including CSPP and Head Start, it is also important to account for children who participate in these programs. These programs have differing eligibility criteria, and, as of 2023–24, not all 4-year-olds were eligible. (See Table 2.) The programs also vary in their educational requirements: TK, CSPP, and Head Start are required to have a prescribed educational program, while subsidized child care includes a wide range of providers, including license-exempt care, and is not required to meet state or federal education standards.
To estimate the number of children in publicly funded PreK, we look at the total number of 4-year-olds enrolled across three programs: TK, CSPP, and Head Start. We estimate that about 25% of children in Head Start are dually enrolled in CSPP, and we adjust the Head Start data accordingly to avoid overcounting.The estimated percentage of children who are dual-enrolled comes from a survey of California Head Start grantees conducted by the American Institutes for Research about the 2014–15 school year. Anthony, J., Muenchow, S., Arellanes, M., & Manship, K. (2016). Unmet need for preschool services in California: Statewide and local analysis. American Institutes for Research. https://www.air.org/sites/default/files/downloads/report/Unmet-Need-for-Preschool-Services-California-Analysis-March-2016.pdf
Source: California Department of Social Services. Child care and development programs (accessed 09/18/24).
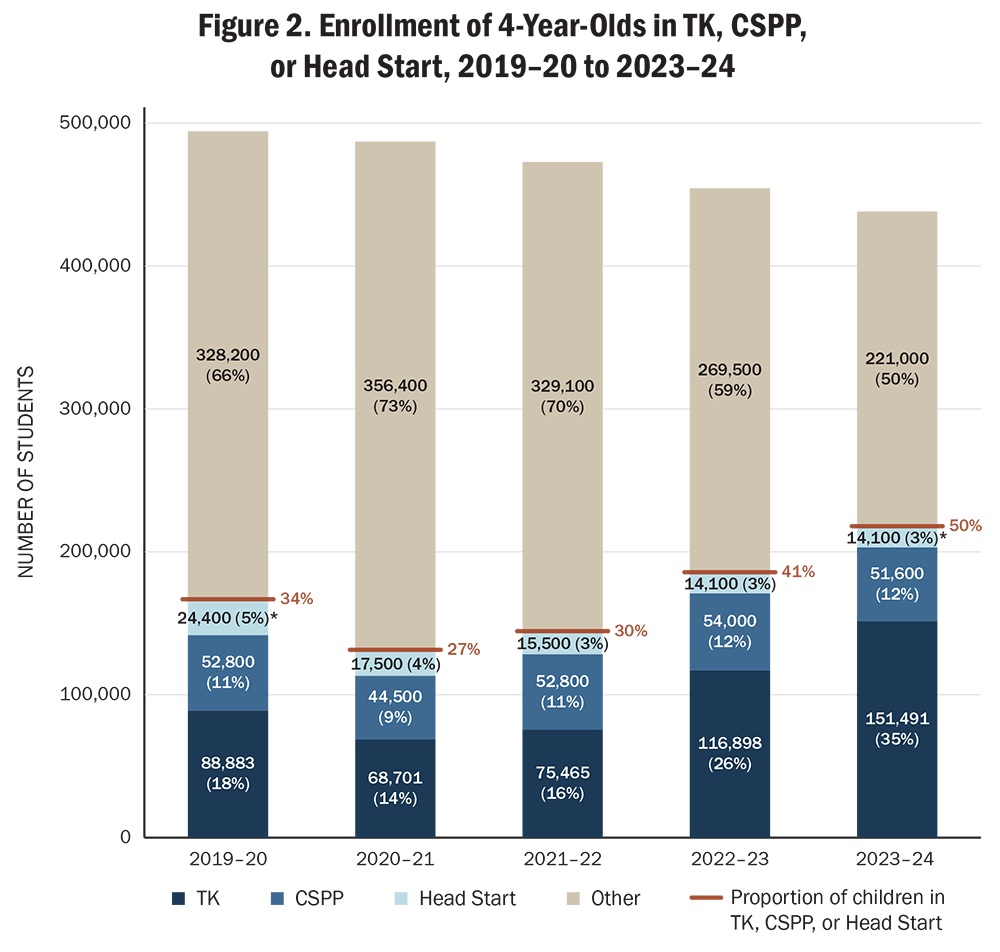
We estimate that the number and proportion of California 4-year-olds enrolled across these public PreK programs have grown substantially between 2019–20 and 2023–24. As shown in Figure 2, the number of all 4-year-olds participating in these programs dropped in the first year of the pandemic but has been rising each year since (see the blue-shaded bars in Figure 2). Combined, the number of 4-year-olds enrolled grew from about 166,100 in 2019–20 to 217,200 in 2023–24 (a 31% increase). At the same time, the estimated number of 4-year-olds in the state (the total number represented by each year’s bar) has declined by 13%, from about 498,000 to 432,000.This decline is projected to persist, with both California’s Department of Finance and the National Center for Education Statistics estimating further reductions in the preschool-age cohorts and in the total student population in the coming years. For more information on the statewide population trends, see Johnson, H., McGhee, E., Subramaniam, C., & Hsieh, V. (2023). What’s behind California’s recent population decline—and why it matters. Public Policy Institute of California. https://www.ppic.org/publication/whats-behind-californias-recent-population-decline-and-why-it-matters/ Partially because of the decline in population but more substantially due to the increases in the number of enrolled 4-year-olds, the overall uptake—or proportion of children served in these programs combined—increased from about 34% in 2019–20 to 50% in 2023–24 (see the orange-shaded lines in Figure 2).
Virtually all of the increase in public PreK enrollment has been in TK. Enrollment in CSPP has been mostly steady over the last 5 years, except for the first year of the COVID-19 pandemic, when it dropped by about 8,000 children.CSPP data are obtained from the California Department of Education. Single-month reports 2020 to 2023. https://www.cde.ca.gov/ds/ad/singlemonthreports.asp; California Department of Education. (2022). California Department of Education (CDE) PreKindergarten (PreK) fact sheet December 2022. https://www.cde.ca.gov/be/ag/ag/yr23/documents/jan23item10a1.docx; CSPP data are reported by statutory age, meaning children born between September 2 and December 1 of the following year (a 15-month span, which includes children who were age 3 at the start of the school year). To make CSPP data comparable to enrollment in TK and Head Start, we removed children who were 3 years old. We assumed an equitable distribution of children born every month, reduced by 3/15 and rounded to the nearest 100. We do not account for dual enrollment of CSPP and TK but expect that the number of children dually enrolled is small, since in 2023–24, 16,700 of the 51,600 4-year-olds in CSPP were age-eligible for TK. In a survey of local education agencies offering TK in the 2022–23 school year, just 1% of districts reported that they blend TK and CSPP. Personal email with Jane Liang, Education Administrator of the Early Care and Education Division, California Department of Education (2024, June 25); Wang, V., Leung-Gagné, M., Melnick, H., & Wechsler, M. E. (2024). Universal prekindergarten expansion in California: Progress and opportunities. Learning Policy Institute. https://doi.org/10.54300/597.103 Head Start’s 4-year-old enrollment declined by about 40% from 2019–20 to 2022–23.Head Start data are obtained from Office of Head Start PIR Reports, Enrollment Statistics Report, https://hses.ohs.acf.hhs.gov/pir/reports. We use the number of Head Start enrollees projected to enter kindergarten in the following school year, rather than the cumulative number of 4-year-olds enrolled in Head Start, for comparability with TK and CSPP data that are collected for a single day or month. To account for children dually enrolled in Head Start and CSPP and avoid overcounting, we assumed that 25% of children were enrolled in both programs and rounded to the nearest 100. Head Start data for 2019–20 were not reported, and data for 2023–24 were not available at the time of writing. We assumed Head Start enrollment equaled enrollment in the prior year (2018–19 and 2022–23, respectively) to calculate public PreK uptake in these years. The decline in Head Start enrollment is likely due to several factors, including a declining population of eligible children and workforce shortages.California’s Early Head Start and Head Start enrollment has declined for all ages compared to pre-pandemic levels, but the largest drop was in 4-year-old enrollment. For more information on enrollment trends in Head Start, see Koski, M. (2023). Insights into Head Start enrollment barriers. Start Early. https://www.startearly.org/post/insights-into-head-start-enrollment-barriers/
In addition to TK, CSPP, and Head Start, many children are served in other publicly funded child care arrangements or in private preschool or child care. Children using subsidized child care attend care in a wide variety of settings that are not required to meet state or federal education standards unless they blend funding with other sources.As of October 2023, about 41% of 4-year-olds in subsidized child care were in enrolled in a center-based program and 40% were in a family child care home, which must meet health and safety standards. An additional 18% were in license-exempt care, including care by a friend, family member, or neighbor. California Department of Social Services, October Enrollments by contract type, setting type, and age group: 2019–2023, received 09/04/24 via personal correspondence with the California Department of Social Services. For more about quality standards, see Melnick, H., Tinubu Ali, T., Gardner, M., Maier, A., & Wechsler, M. (2017). Understanding California’s early care and education system. Learning Policy Institute. However, subsidized child care serves a growing number and proportion of children in California. When the number of children enrolled in subsidized child care is added to the number of children enrolled in TK, CSPP, and Head Start, the state enrolled about 37% of all 4-year-olds in 2019–20 and 55% in 2023–24.California Department of Social Services, October enrollments by contract type, setting type, and age group: 2019–2023, received 09/04/24 via personal correspondence with the California Department of Social Services. Programs in this analysis include Alternative Payment, CalWORKs Stages 2 and 3, Family Child Care Home, General Child Care, General Migrant Care, Migrant Alternative Payment, and Severely Handicapped. Enrollment data for CalWORKs 1 and Community College Stage 2 are not included. Children enrolled in a child care program may be dually enrolled in TK, CSPP, or Head Start, leading to potential overestimates of the total number of children served. (See Table 3.)
Finally, according to data from the American Community Survey, about 25% of 4-year-old children in California were enrolled in private preschool or day care in 2022.Learning Policy Institute analysis of the American Community Survey. (2022). Enrollment by type of school; Ruggles, S., Flood, S., Sobek, M., Backman, D., Chen, A., … Schouweiler, M. (2024). IPUMS USA: Version 15.0 [ACS 2022]. IPUMS, 2024. https://doi.org/10.18128/D010.V15.0 These children likely overlap with children enrolled in publicly subsidized child care, CSPP, and Head Start. We do not have an approximation of how many might be dually enrolled.
Sources: California Department of Education. Transitional kindergarten data from 2019–20 to 2023–24; California Department of Education. (2020–21 to 2023–24). California State Preschool Enrollment; California Department of Education. (2019–20). California Department of Education (CDE) PreKindergarten (PreK) fact sheet December 2022; Office of Head Start PIR Reports. (n.d.). Enrollment Statistics Report; United States Census Bureau. (2024). State population by characteristics: 2020–2023. U.S. Census’ annual estimates of the resident population by single year of age and sex for California: April 1, 2020 to July 1, 2023; United States Census Bureau. (2021). State population by characteristics: 2010–2019. Annual estimates of the resident population by single year of age and sex for California: April 1, 2010 to July 1, 2019.
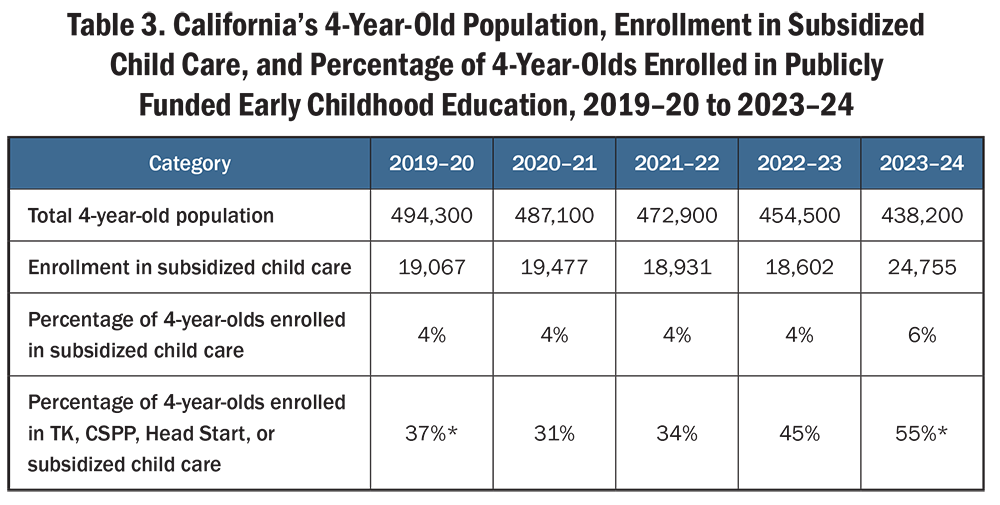
Sources: Learning Policy Institute analysis of TK, CSPP, and Head Start data (see Figure 2); California Department of Social Services. October enrollments by contract type, setting type, and age group: 2019–2023; United States Census Bureau. (2024). State population by characteristics: 2020–2023. U.S. Census’ annual estimates of the resident population by single year of age and sex for California: April 1, 2020 to July 1, 2023; United States Census Bureau. (2021). State population by characteristics: 2010–2019. Annual estimates of the resident population by single year of age and sex for California: April 1, 2010 to July 1, 2019.
Conclusion
California’s publicly funded PreK enrollment is rapidly increasing. In just 2 years from 2021–22 to 2023–24, transitional kindergarten enrollment has doubled, from about 75,500 to more than 151,500 children. Looking at publicly funded PreK programs in the past 5 years—TK, CSPP, and Head Start— California went from serving about 34% of all 4-year-olds in 2019–20 to 50% in 2023–24.
Publicly funded PreK in California is progressing toward being universal; however, there are still many children who do not participate in a publicly funded program. While not the focus of this analysis, enrollment of 4-year-olds in the state’s PreK options may be affected by several factors, including program accessibility and hours of care, families’ awareness of what programs are available, and preference for other private PreK programs. Future research should explore how families make decisions about their PreK options and other factors that drive PreK enrollment. In addition, ensuring the quality of these programs is also crucial.Research suggests that program quality mediates child outcomes. See, for example, Burchinal, P., Kainz, K., Cai, K., Tout, K., Zaslow, M., … Rathgeb, C. (2009). Early care and education quality and child outcomes. Office of Planning, Research, and Evaluation & Child Trends; Sussman, J., Melnick, H., Newton, E., Kriener-Althen, K., Draney, K., … Gochyyev, P. (2022). Preschool quality and child development: How are learning gains related to program ratings? Learning Policy Institute. https://doi.org/10.54300/422.974 It will therefore be important to examine the quality of these programs and whether children from different racial, ethnic, and linguistic backgrounds have equitable access to high-quality PreK.
Progressing Toward Universal Prekindergarten in California (brief) by Hanna Melnick and Emma García is licensed under the Creative Commons Attribution-NonCommercial 4.0 International License.
This research was supported by the Ballmer Group and the Heising-Simons Foundation. Additional core operating support for LPI is provided by the William and Flora Hewlett Foundation, Raikes Foundation, Sandler Foundation, Skyline Foundation, and MacKenzie Scott. The ideas voiced here are those of the authors and not those of our funders.
Cover photo by Allison Shelley/The Verbatim Agency for EDUimages.
