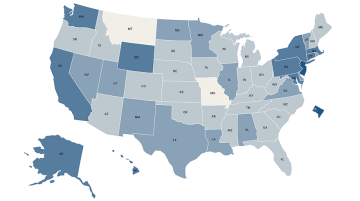
Note: Annual starting salary is defined as the salary paid to a teacher with a bachelor’s degree and no prior experience. Annual starting salaries were collected by the National Education Association from district teacher salary schedules or district compensation plans. The national average is calculated as the average across districts. Annual starting salaries vary by district, so within states there are locales that offer starting salaries higher and lower than the state average.
Source: NEA 2019-2020 Teacher Salary Benchmark Report.
Back to top
Note: Annual starting salary is defined as the salary paid to a teacher with a bachelor’s degree and no prior experience. Annual starting salaries were collected by the National Education Association from district teacher salary schedules or district compensation plans.
State cost-of-living adjustments are calculated using Regional Price Parities from the U.S. Bureau of Economic Analysis. Regional Price Parities are generated using average price quotes for a wide array of items from the Consumer Price Index such as apparel, education, food, housing, medical, recreation, transportation, and other goods and services. Regional Price Parities are expressed as a percentage of the overall national level. The national average starting wage for teachers does not get adjusted.
Annual starting salaries and cost of living also vary by district, so within states there are locales that offer adjusted starting salaries that are higher and lower than the state average.
Sources: NEA 2019-2020 Teacher Salary Benchmark Report; U.S. Bureau of Economic Analysis, Regional Price Parity Indices 2020.
Back to top
Note: The wage competitiveness index represents the average public school teacher weekly wage as a percentage of the estimated weekly wage for other college-educated workers within each state. Weekly wages provide a comparison that adjusts for any differences in the work year across occupations. The data presented are the Economic Policy Institute’s weekly wage penalty data transformed to a 0–100% scale. The wage competitiveness estimates are based on Population Survey data and control for factors that typically influence wages. State estimates are based on data from 2014 through 2019, and the national estimate is based on 2019 data.
Source: Allegretto, S., & Mishel, L. (2020). Teacher Pay Penalty Dips but Persists in 2019: Public School Teachers Earn About 20% Less in Weekly Wages Than Nonteacher College Graduates. Economic Policy Institute.
Back to top
Back to top
Understanding Teacher Compensation: A State-by-State Analysis by Desiree Carver-Thomas and Susan Kemper Patrick is licensed under a Creative Commons Attribution-NonCommercial 4.0 International License.
This research was supported by the Carnegie Corporation of New York and the Yellow Chair Foundation. Core operating support for the Learning Policy Institute is also provided by the Heising-Simons Foundation, William and Flora Hewlett Foundation, Raikes Foundation, and Sandler Foundation. We are grateful to them for their generous support. The ideas voiced here are those of the authors and not those of our funders.
