When Teachers Leave: Understanding the Financial Impacts on Schools

This blog is part of the series, Solving Teacher Shortages, which highlights innovative and evidence-based initiatives and explores policy options and other approaches to building a strong and stable teacher workforce.
Every year, approximately one in six public school teachers across the United States leaves their school or leaves the profession altogether, contributing to the country’s teacher shortages. Only about 16% of teachers leaving the profession are retiring, while other leavers cite reasons like pursuing other careers, needing a higher salary, and dissatisfaction with teaching or their specific position. Aside from retirement, these reasons can be prevented with the right policies and resources in place.
When these teachers leave, they take with them valuable knowledge about how students learn, their subject area, and their school. Leaving also affects their school district’s bottom line, given the considerable time, energy, and resources that go into finding a replacement and providing training and support for that new teacher (such as mentoring, new teacher affinity groups, reduced teaching loads, or extra time to plan).
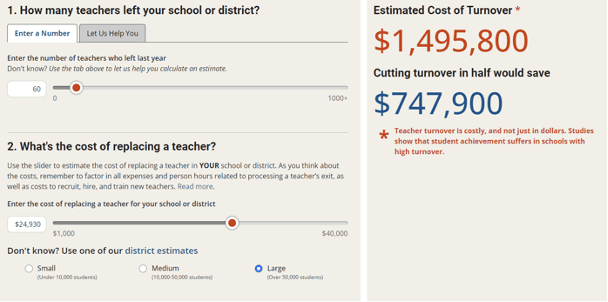
The Learning Policy Institute’s updated calculator, “What’s the Cost of Teacher Turnover?,” provides a valuable tool to estimate the financial cost of teacher turnover for schools or districts. Initially launched in 2017, our tool has been revised to integrate a wider set of data as well as make adjustments for inflation. The calculator offers a straightforward way for educational leaders to estimate the cost of turnover.

Estimating the Financial Cost of Turnover
The calculator estimates the per-teacher cost of turnover. These estimates are based on five studies that calculate the financial costs of the separation, recruiting, hiring, and training associated with teacher turnover in nine different school districts. Based on the patterns in that research, the calculator provides three estimates capturing the per-teacher cost of turnover based on district size:
- $11,860 per teacher for small districts (under 10,000 students)
- $16,450 per teacher for medium districts (10,000–50,000 students)
- $24,930 per teacher for large districts (more than 50,000 students)
While the districts studied vary in their specific investments and costs associated with turnover, larger districts may have higher costs, on average, because of the added complexity and staff needed for hiring, recruiting, and training larger numbers of teachers (including activities such as interviewing and training for new teachers happening at both the district and school levels).
Higher per-teacher turnover costs are not inherently bad. Those costs may reflect investments in thoughtful recruitment strategies that could lead to better hiring or in intensive teacher induction and mentoring programs that can improve retention. Among the studied districts that provided detailed cost information, between half and four-fifths of the total cost of turnover was attributed to training and supports for the new teachers replacing those who had left. Such investments may reduce turnover in the long run, and districts can use the calculator—along with other tools, like this teacher induction cost-benefit workbook—to weigh such investments against potential costs related to turnover.
However, schools or districts with chronically high turnover and short teacher tenures watch those investments walk out the door, only to have to make them once again with new hires. And there are other negative effects of turnover beyond the financial costs.
The Broader Impact of Turnover
When teachers leave, it can disrupt the continuity of educational experiences for students and fracture professional support and relationships among teachers. High turnover rates are not merely a logistical challenge; they also impact student achievement. Controlling for other factors and characteristics, students in grade levels with higher teacher turnover have lower average achievement in English language arts and math, with this relationship being stronger in schools serving more students of color and economically disadvantaged students.
While turnover tends to be higher among teachers for all types of schools in some subject areas, such as special education and English language development, higher teacher turnover often occurs in schools serving more students from marginalized groups. These schools often face the dual challenge of higher turnover and difficulties with hiring fully certified and experienced teachers, which can intensify educational inequities. In schools serving more students of color, teachers are 2.5 times as likely to be uncertified as in schools enrolling fewer students of color, as measured by the Civil Rights Data Collection. These teachers are more likely to leave the profession than their fully certified peers, exacerbating the cycle of high turnover in the schools they serve.
Though an ongoing issue in the United States, teacher turnover increased in many states during the COVID-19 pandemic and has had lingering effects. A nationally representative survey of district leaders from 2022–23 suggests that turnover has, on average, fallen from its recent high in 2021–22 but remains higher than pre-pandemic levels. Schools are also increasingly grappling with budget constraints due to the end of ESSER funds, recent tax cuts, decreases in enrollment, or ongoing issues with inadequate funding formulas.
The financial toll of teacher turnover, already a concern, may hit even harder as districts face tighter budgets. By leveraging tools like the updated calculator, school leaders can make informed decisions to invest in policies that not only retain teachers but also save resources in the long run. Effectively addressing turnover is not only about keeping teachers and improving fiscal health; it’s also about securing the future of our students and the quality of education they receive.
