Tracking the State of the Teacher Workforce Across States

As many states across the country deal with teacher shortages, more attention is being paid to the conditions of teaching—in particular, the extent to which salaries and working conditions influence the attractiveness of teaching as a profession. These conditions vary substantially across states, as do teacher supply and turnover. So where are the best places to teach in the United States? Generally speaking, teaching conditions in northeastern states—like Vermont, New Hampshire, Massachusetts, New York, and New Jersey—rank in the top tier. In these states, salaries are more competitive and working conditions are more supportive, based on teachers’ views of their schools.
These and many other indicators are included in a new interactive state-by-state map released by the Learning Policy Institute (LPI). The State of the Teacher Workforce: A State-by-State Analysis of Factors Influencing Teacher Shortages, Supply, Demand, and Equity includes more than 40 indicators describing teaching conditions for the more than 3 million public school teachers in the United States. They can be used to inform policy strategies addressing shortages and ensuring equitable access to qualified and experienced teachers.
The map draws from a range of sources to identify the conditions of teaching in each state, as well as factors influencing teacher supply and demand. It also illustrates the extent to which children have equitable access to certified and experienced teachers and access to a diverse teaching workforce. In addition, a companion piece compiling state-reported data provides details on teaching positions left vacant or filled by teachers without full certification—key indicators of the extent of shortages.
Teachers are critical for student success, but many schools struggle to fill their classrooms with fully certified teachers. Such shortages impact all states, and are highest in schools serving more students of color and students from low-income backgrounds. Uncertified or inexperienced teachers are generally less effective and more likely to leave their schools or the profession than fully prepared and experienced teachers. Unfilled vacancies also typically lead to canceled classes and larger class sizes, as well as to a revolving door of substitute teachers.
Not only do shortages undermine learning conditions for students, and especially those already furthest away from opportunity, the current context appears even more concerning than in the past: interest in teaching is at its lowest point in decades, and teachers are more than twice as likely as other working adults to report frequent job-related stress as they deal with increasing student mental health challenges and declines in student performance, exacerbated during the pandemic.
The new map is part of LPI’s ongoing research on strategic policies that can build and sustain a strong, stable, and diverse teacher workforce. It illustrates two key sets of indicators and overall summary ratings that capture:
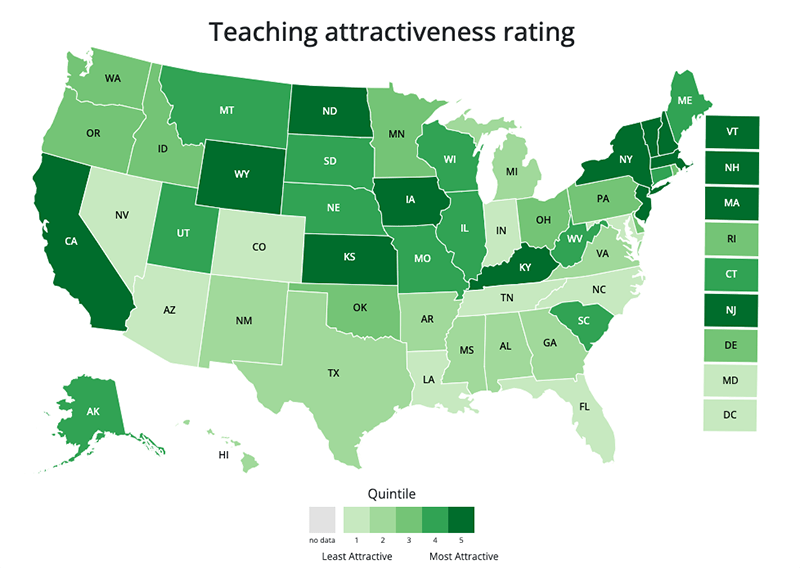
- Teaching attractiveness: The extent to which there are supportive conditions in each state for teacher recruitment and retention, including compensation, working conditions, school resources, teacher turnover and hiring, and qualifications of the teacher workforce.
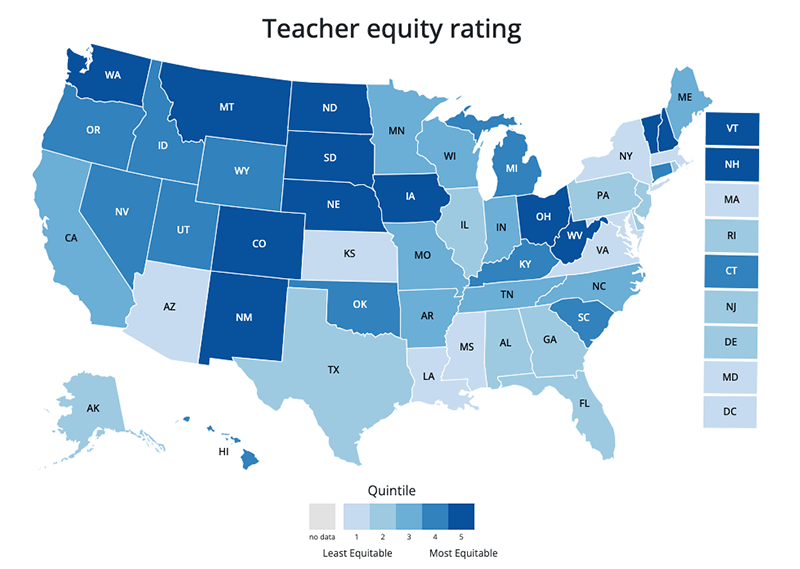
- Teacher equity: The extent to which students in high- and low-poverty schools and those in high- and low-minority schools in each state have equitable access to certified and experienced teachers.
The map focuses on state-level measures since state policies can greatly influence the condition of the teacher workforce. Based on the combined indicators, we rate states on their attractiveness to teachers and their equity in distributing teachers to different schools. For example, state policies on teacher preparation, accountability, and funding formulas play a large role in shaping learning environments and, in turn, teacher working conditions.
Where are conditions for teaching most attractive?
The map’s teaching attractiveness rating summarizes numerous factors that can support recruiting and retaining an effective, stable, and diverse teacher workforce, including compensation, working conditions, and school resources. Compensation influences who may be interested in becoming a teacher and whether teachers enter or stay in the profession; low compensation is often cited as a top barrier for college students considering a career in teaching. Other working conditions, like supportive school leadership, may be equally critical to retaining teachers and building a strong workforce. Additionally, the teaching attractiveness indicators capture school resources, teacher qualifications, and staffing metrics, including how many teachers say they are planning to leave teaching.
Based on our analysis, Vermont, North Dakota, New Hampshire, Kansas, New York, California, Wyoming, Kentucky, New Jersey, Iowa, and Massachusetts have the highest teaching attractiveness ratings, indicating that teachers in these states experience, on average, more competitive salaries and more supportive teaching conditions.
Where do students have equitable access to qualified teachers?
The teacher equity rating summarizes the degree to which students’ access to certified and experienced teachers varies across schools within each state. The indicators in this rating compare whether schools serving more students of color or more students from low-income families are as likely to employ uncertified or inexperienced teachers as schools serving more white students or students from more economically advantaged families. Although there are other potential measures of teaching quality and effectiveness, certified teachers—those entering the classroom having met all state standards—tend to have more positive impacts on student outcomes and are more likely to stay in the profession for longer. Additionally, student learning and non-test outcomes like attendance and classroom behavior indicate that teachers tend to become more effective with experience.
From our analysis, we found that several states with high proportions of students of color and students from low-income backgrounds, including Louisiana, Maryland, Arizona, Mississippi, and New York, have the least equitable access to certified and experienced teachers across their schools. Such findings point to the need for these states to further their efforts to ensure that all their students have access to high-quality teachers, regardless of race/ethnicity or family economic status.
Are there other factors that influence the supply and demand of teachers and the conditions of the workforce?
Beyond the teaching attractiveness and teacher equity ratings described above, other factors also shape the supply and demand for teachers. In our analysis, we provide additional indicators that state policymakers may want to consider when thinking about state efforts to support an adequate and diverse supply of teachers. These include enrollment in the state’s teacher preparation programs; student enrollment changes in the state’s public schools; other demographic characteristics of the state’s current teacher workforce, such as the share of teachers of color or of teachers approaching retirement age; as well as various financial stressors teachers face, like student loans, working additional jobs beyond teaching, and unreimbursed spending on school supplies.
Together, the interactive map and the state-level data scan released today depict the state of the teacher workforce and teacher shortages, which can inform policymaking in supporting and strengthening the teacher workforce and ensuring all students have access to qualified teachers.