How Preparation Predicts Teaching Performance Assessment Results in California

Summary
Teaching performance assessments (TPAs) can be used to assess the readiness of potential teachers because they require candidates to provide evidence of their planning and teaching skills through classroom videos accompanied by commentaries and evidence of student learning from actual teaching experiences. At least 16 states have adopted a TPA as a requirement for teaching candidates, and California was one of the first to do so. During the pandemic, TPA implementation was difficult, and variability in performance on TPAs increased. This study explored the sources of variability for California teaching candidates who took either the California Teaching Performance Assessment (CalTPA) or the educative Teaching Performance Assessment (edTPA) as in-person teaching was reestablished in 2021–22 and 2022–23. During this period, over 90% of California’s tested candidates passed a TPA, but passing rates varied considerably across programs. While 63% of programs had pass rates above 90% and about one quarter of programs had all of their tested candidates pass a TPA, about 1 in 10 programs had fewer than 80% of candidates pass. Preservice candidates were more likely to pass than intern candidates, and secondary and special education programs had higher pass rates, on average, than elementary programs. Candidates from programs in which more completers reported program support for the TPA process, sufficient feedback during clinical practice, and more extensive content-specific training around how to teach reading and math were also more likely to pass.
The report on which this brief is based can be found here.
Introduction
Ensuring that teaching candidates are well prepared to enter the classroom is a critical mission for teacher preparation programs and state agencies that approve programs and set teacher licensure standards. Teaching performance assessments (TPAs) can be used to assess the readiness of potential teachers because they require candidates to provide evidence of their teaching knowledge and skills through classroom videos, lesson plans, student work, and analysis of teaching and learning. Multiple studies have found that TPA scores predict effectiveness once candidates enter the classroom as licensed teachers. TPAs have been adopted in at least 16 states as a requirement of either teacher preparation program completion or initial licensure. California, the focus of this study, was one of the first states to adopt a TPA as a licensure requirement for beginning teachers.
The report on which this brief is based explored whether certain preparation experiences predicted success on the California Teaching Performance Assessment (CalTPA) or the educative Teaching Performance Assessment (edTPA), the two widely available TPAs used across California preparation programs. Focusing on the 2021–22 and 2022–23 school years, this analysis examined whether TPA success for more than 18,000 California teaching candidates varied by preparation pathway, program, and the nature of preparation experiences as reported by respondents on the annual survey administered to all those completing preparation and applying for their preliminary teaching credential with the California Commission on Teacher Credentialing (CTC).
California’s Use of Teaching Performance Assessments
Since 2008, California’s general education teaching candidates have been required to pass a state-approved TPA before receiving their preliminary teaching credential, and this requirement was extended to education specialist (i.e., special education) teaching candidates starting in 2022. There are currently three TPAs approved for use in California: the CalTPA, the edTPA, and the Fresno Assessment of Student Teaching (FAST). Preparation programs tend to choose one TPA for use with all teaching candidates and must follow the CTC’s program standards for the implementation of the chosen TPA. The CTC outlines standards for TPA administration and required supports, including appropriate materials and training, formative preparation opportunities, and additional supports for candidates who do not pass a TPA on their initial attempt.
A few notable changes have been made to California’s TPA policy in recent years. Starting in 2016, all three TPAs were redesigned to align with the CTC’s updated Teaching Performance Expectations, the state’s standards for beginning teachers. The CalTPA and edTPA now use centralized administration and scoring, in which a set of trained scorers assess candidates across the state, although teacher preparation programs may opt to continue with local scoring. The COVID-19 pandemic interrupted the implementation of TPAs, and teaching candidates between May 2020 and August 2022 had the option to defer the TPA requirement until after they received their preliminary credential. As of August 2022, the California legislature began waiving fees for licensing examinations to reduce barriers for teaching candidates. In December 2023, the CTC decided to offer a secondary passing standard in which candidates who score just below the CalTPA or edTPA passing threshold can receive their preliminary credential if their preparation program can demonstrate their proficiency on state standards.
Approved Teaching Performance Assessments (TPAs)
California’s approved TPAs must meet the same underlying design standards and align with the CTC’s Teaching Performance Expectations for beginning teachers.
CalTPA: The CalTPA is administered in two cycles, and each cycle requires candidates to submit videos of instruction and engage in a four-step process of planning, teaching and assessing, reflecting, and applying. The first cycle focuses on developing a content-specific lesson, including plans for three focus students to address their specific needs. The second cycle focuses on standards, assessment, and instructional decision-making and requires videos capturing student assessment and feedback, use of educational technology, and students’ use of higher-order thinking skills and self-assessment. Elementary candidates must take one of the cycles of assessment in literacy and the other cycle of assessment in math.
edTPA: The edTPA is administered in one cycle that has three tasks that capture planning, instruction, and assessment of student learning. The first task includes developing three to five content-specific lessons for a class, including three focus students. The second task requires videos of instruction and interactions with students. The third task requires analysis of student work and feedback, including the three focus students. Elementary candidates must participate in a fourth task that focuses on assessing mathematical or literacy learning.
FAST: The FAST is administered by California State University, Fresno. Since it is not in widespread use, it is not included in this analysis. However, it serves as a useful example of how an individual teacher preparation program can successfully create and administer their own TPA.
Sources: California Commission on Teacher Credentialing. (2023). CalTPA program guide; California State University, Fresno. (2019). Fresno Assessment of Student Teachers (FAST 2.0): A manual for teacher candidates; Pearson Education. (2024). edTPA for California.
TPA Performance Across Pathway and Program
Differences Across Preparation Pathway
Preservice candidates were more likely than intern candidates to be successful on a TPA. As of 2021–22, three quarters of California’s preparation program completers were from “traditional” preservice programs in which coursework and clinical practice (i.e., student teaching or residency) occurs before becoming a teacher of record. As shown in Table 1, 77% of the preservice candidates who took the CalTPA or edTPA in 2021–22 or 2022–23 passed on their first try, and 92% of these candidates passed across all of their TPA attempts. Among candidates in internship programs who served as teachers of record while completing preparation, 67% passed a TPA on their first try and 88% passed across all attempts. Candidates who reported on their completer surveys that they were in residency programs—in which they work for a full year alongside a mentor teacher while taking coursework—were more likely to pass a TPA on their first attempt than either student teachers or interns. This comparison was only available for a subset of teaching candidates whose TPA records could be linked to their completer survey and does not include any candidates from the California State University system.
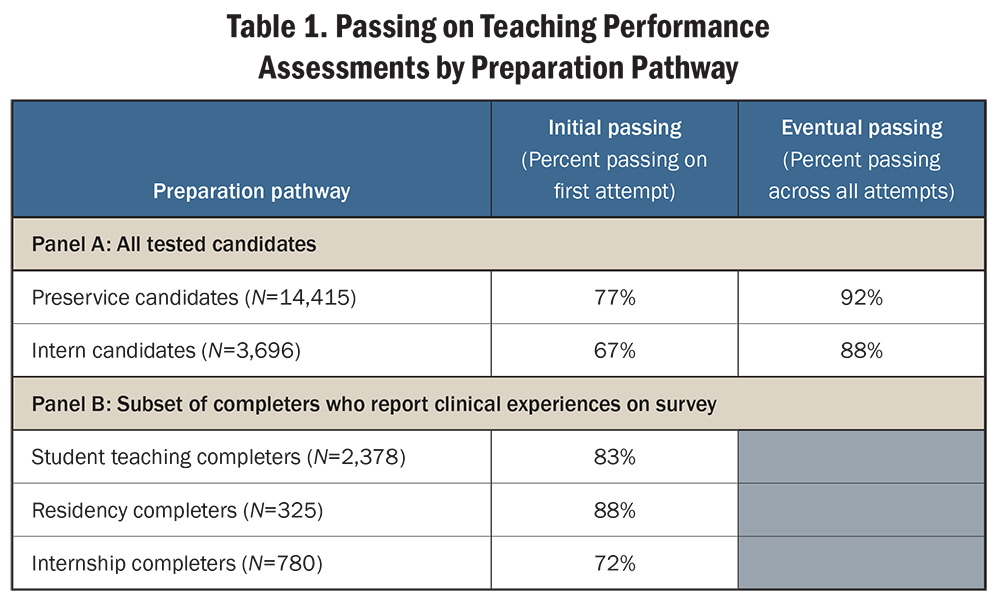
Source: Learning Policy Institute analysis of California Commission on Teacher Credentialing data. (2024).
Differences Across Preparation Programs
Passing rates varied considerably across preparation programs. Across the 263 preparation programs included in this analysis, 167 programs (63%) had more than 90% of their tested candidates pass a TPA, and 61 programs (23%) had all of their tested candidates pass a TPA. In contrast, 35 programs (13%) had passing rates under 80%, including 14 programs with pass rates below 67%. Figure 1 illustrates how passing rates varied across single subject (i.e., secondary) programs by showing the percentage of tested candidates for each program who passed a TPA across all attempts. As shown in Figure 1, there were more intern programs than preservice programs with lower passing rates, although there was wide variation in passing rates for both intern and preservice programs. Among the secondary candidates in this sample who never passed a TPA (N=593), they were more likely to attend internship programs or programs run by private institutions of higher education compared to passing candidates.
Data available for a subset of completers suggest that racial and ethnic disparities in pass rates appear to vary with overall program performance. While there were disparities in pass rates by candidate race and ethnicity among the low-performing programs, among programs with passing rates above 90%, there were no statistically significant differences in passing rates by race and ethnicity.
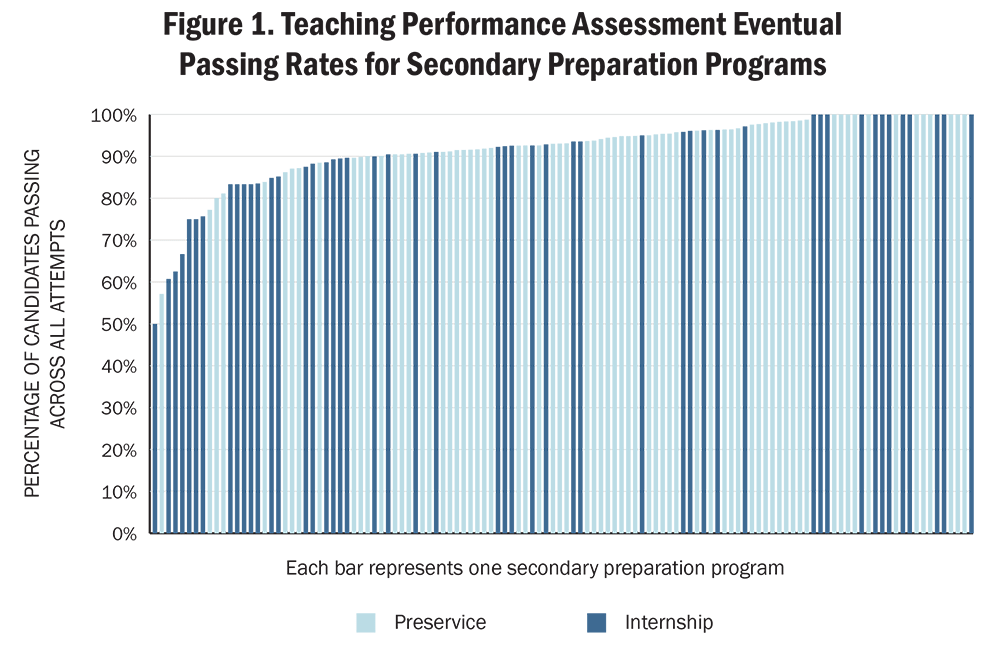
Source: Learning Policy Institute analysis of California Commission on Teacher Credentialing data. (2024).
Passing rates also varied by credential field. Overall, single subject (i.e., secondary) and educational specialist (i.e., special education) programs had higher passing rates, on average, than multiple subject (i.e., elementary) programs. Notably, elementary candidates must document their teaching skills across two subjects (literacy and math), and each assessment has added elements for these candidates. This added complexity, along with pandemic-era challenges with clinical practice in elementary programs, could partially explain these differences.
TPA Performance by Preparation Experiences
Prior research on TPAs across states has found that certain preparation experiences—candidate participation in practice tasks mimicking TPA tasks, certain coursework features, and characteristics of clinical placement for student teachers—are associated with candidates’ TPA success. As shown in the previous section, passing rates varied considerably across California preparation programs. This analysis examined whether program-level ratings on certain aspects of preparation—created using responses from program completer surveys from the California Commission on Teacher Credentialing (CTC)—predicted differences in TPA passing and scores.
Differences by Completers’ Perceptions of TPA Support
Two thirds of preparation completers reported being well supported by their program to take a TPA, and program-level ratings of support were related to the likelihood of passing. Elementary and secondary program completers were asked six questions about TPA support provided by their program on the completer surveys. As shown in Figure 2, 66% of responding completers reported that their programs prepared them well or very well for a TPA, 23% felt adequately prepared, and 11% reported being not at all or poorly prepared. Completers from secondary preservice programs were the most likely to report feeling well or very well prepared for the TPA process, compared to completers from elementary preservice, elementary internship, and secondary internship programs.
In addition to this overall question about preparation for a TPA, completers were asked five other questions about their program’s support for the TPA process. These survey responses were averaged to create program-level ratings on TPA support. These program ratings were predictive of a candidate’s likelihood of passing on their first attempt and across all of their attempts. For example, the odds of passing across all attempts were 1.7 times higher among elementary and secondary candidates from programs with the highest ratings of TPA support compared to candidates from the lowest-rated programs.
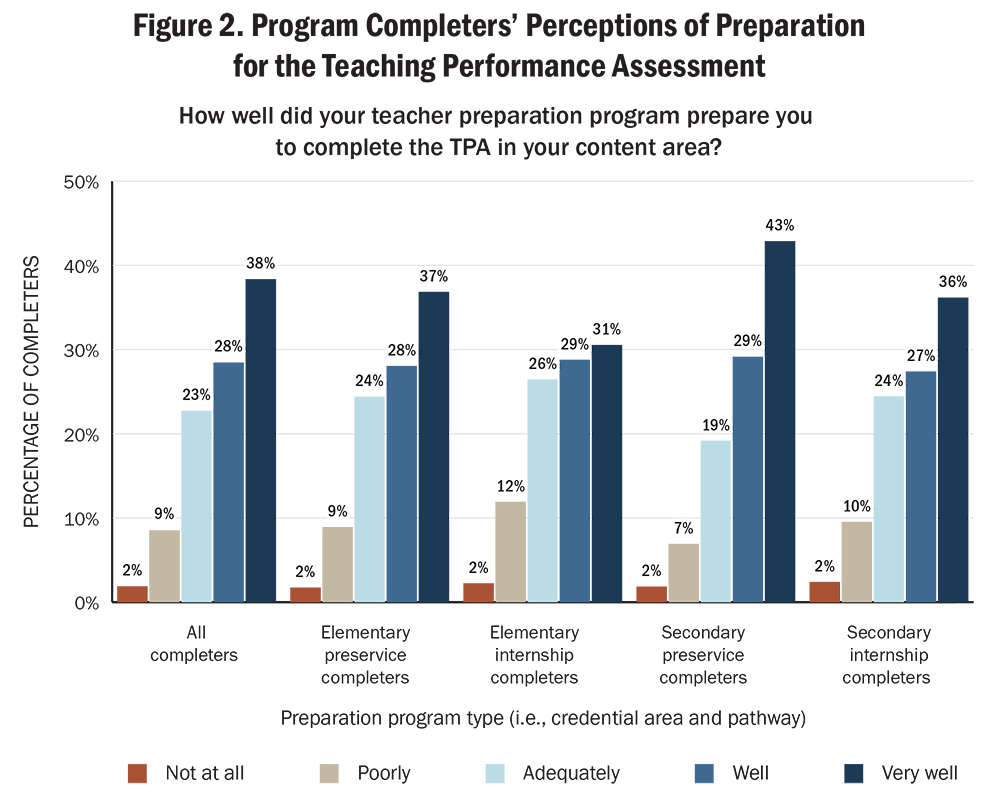
Source: Learning Policy Institute analysis of California Commission on Teacher Credentialing data. (2024).
Preparation in Teaching Literacy and Math
Elementary and special education candidates from programs where completers reported more opportunities to learn about teaching literacy and math were more likely to be successful on a TPA. The program completer survey asks completers from elementary and special education preparation programs about their opportunities to learn how to teach specific aspects of literacy and math (e.g., learn ways to teach decoding skills, adapt math lessons for students with diverse needs). Program-level ratings on preparation in literacy and math—created from these survey responses—were associated with the likelihood of passing and TPA scores. As shown in Figure 3, the odds of passing across all attempts were nearly 2 times higher for candidates from the highest-rated programs on preparation in literacy compared to candidates from the lowest-rated programs, while the odds of passing across all attempts were 1.4 times higher for candidates from the highest-rated programs on preparation in math compared to candidates from the lowest-rated programs.
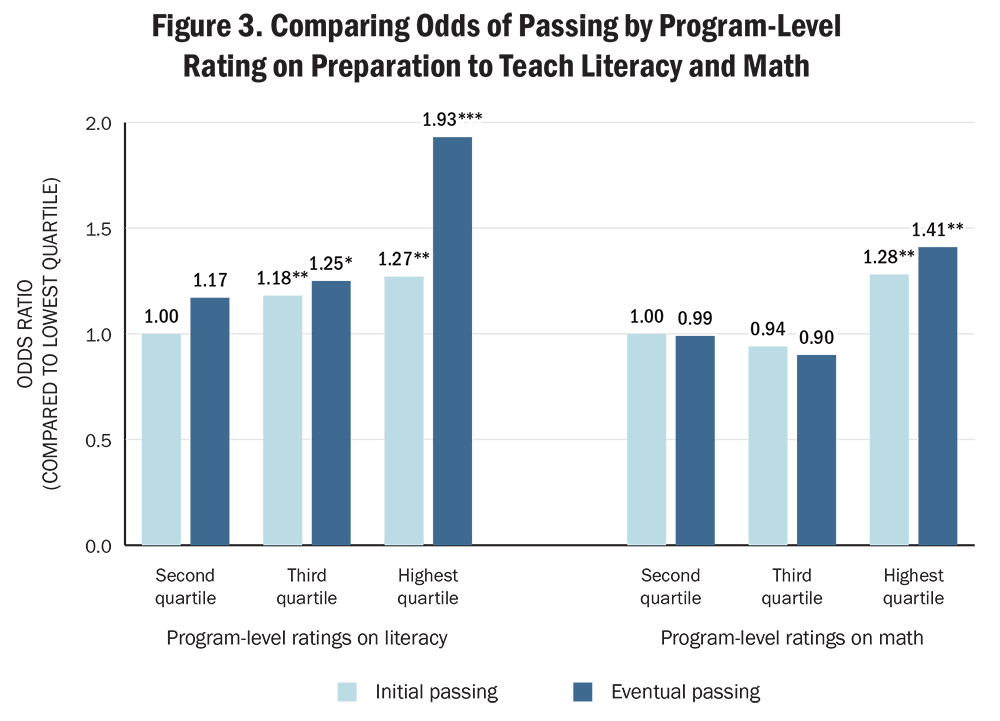
Source: Learning Policy Institute analysis of California Commission on Teacher Credentialing data. (2024).
Clinical Support
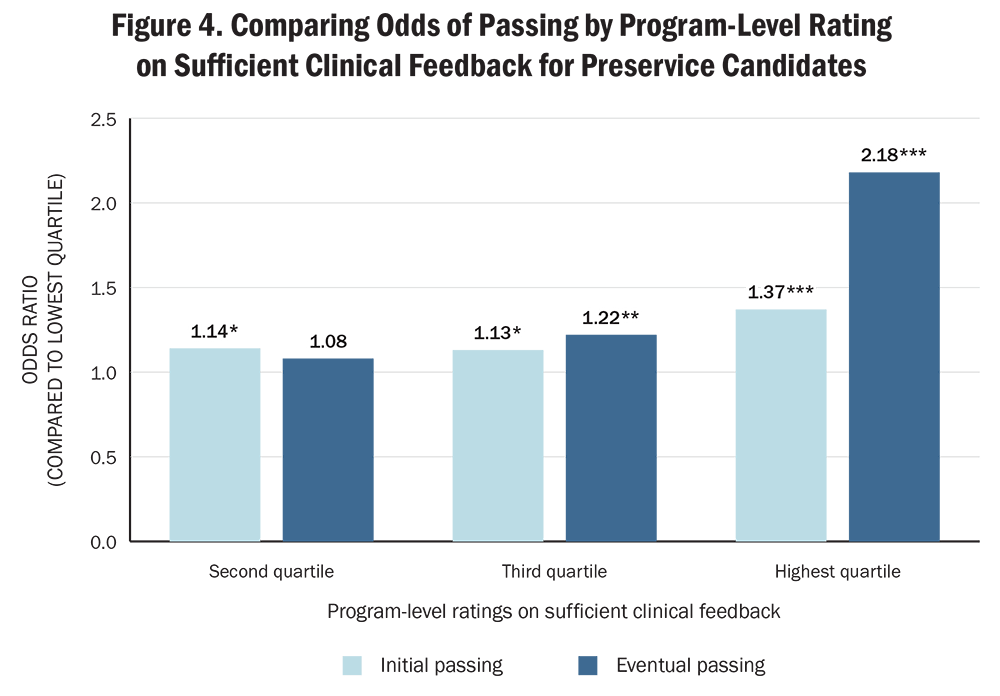
Preservice candidates from programs in which completers report sufficient clinical support were more likely to be successful on a TPA. The program completer survey asked completers to report on the quantity of clinical support offered by program faculty (i.e., communication, observations, and feedback about their teaching). CTC’s program standards require that program supervisors observe and evaluate candidates at least four times per quarter or six times per semester, so this survey data was used to construct a program-level rating based on the percentage of completers who reported that faculty had provided feedback on their classroom instruction more than five times (i.e., sufficient clinical feedback). For preservice candidates, program-level ratings on sufficient clinical feedback were predictive of TPA pass rates across all credential areas. As shown in Figure 4, the odds of passing a TPA across all attempts were more than 2 times higher for candidates from the programs in which almost all completers reported sufficient clinical feedback, compared to candidates from the programs in which a lower percentage of completers reported such support. Program-level ratings on clinical support were not predictive of internship candidates’ success on a TPA.
Source: Learning Policy Institute analysis of California Commission on Teacher Credentialing data. (2024).
Implications
Since California requires teaching candidates to pass a teaching performance assessment (TPA) before they can receive their preliminary teaching credential, it is critical to understand how teacher preparation programs (TPPs) can support candidates through the TPA process. When examining TPA results for California candidates in 2021–22 and 2022–23, this analysis repeatedly finds average differences in the likelihood of passing a TPA that are associated with candidates’ preparation pathway, program, and experiences. Those who have the opportunity to complete student teaching or residency programs—in which they can practice their teaching in the classroom of a mentor teacher before becoming a teacher of record—are more likely to pass a TPA on their first attempt or across all attempts. The types of preparation experiences associated with higher chances of passing—increased access for teaching candidates to learn how to teach in their content areas and opportunities to practice those skills with sufficient observation and feedback from TPP faculty—are preparing candidates for the everyday tasks of teaching. Prior research underscores that these types of preparation experiences are associated with candidates’ own feelings of preparation; employer ratings of preparation; and, in some cases, the effectiveness of teaching candidates once they enter the classroom.
These differences in TPA success across programs and experiences underscore the importance of ensuring that candidates are provided sufficient opportunities during preparation to practice their teaching with support and then document those skills on a TPA. The findings also highlight the importance of ensuring that elementary teaching candidates get strong opportunities to learn about and practice skills related to teaching literacy and math, which are strongly related to TPA success.
Teaching candidates do not have equal access to high-quality preparation that sets them up for success on a TPA and in their career as a beginning teacher. Several recent statewide changes have increased access to preparation and lowered some potential barriers for teaching candidates. State investments in the Golden State Teacher Grant Program and the Teacher Residency Grant Program are meant to improve access to preparation by offsetting the costs of preparation and creating more affordable preparation options in which candidates get intensive clinical practice. In addition, recent state budget allocations now cover the cost of all licensure exams for California teaching candidates. Given that a substantial subset of teaching candidates in this analysis did not pass on their first attempt, covering the cost of all assessments—which previously cost $300 for both the CalTPA and edTPA—is an important step to ensure that TPA assessment costs are not a financial barrier for potential teachers.
TPA data, along with the program completer survey data analyzed here, can help support continuous improvement among programs. Indeed, many California programs already use these data to target support for individual candidates and make programmatic adjustments. However, there are many barriers to integrating this form of data use into practice, including challenges with resources and capacity. Some programs, especially small programs outside of the public university systems, may need better support or systems to be able to learn from their TPA results.
The CTC is particularly well positioned to provide additional support for programs with the lowest TPA passing rates through the accreditation process, especially to ensure that these programs are upholding the program standard related to TPA implementation. The CTC already regularly holds “digging deeper” seminars in which TPP faculty share best practices about support for TPAs; hosts an annual conference for TPPs focused on the implementation of TPAs; and provides several resources specific to the CalTPA—including office hours with CTC staff, multiple trainings for TPP faculty, and quarterly meetings for CalTPA coordinators. Building on these existing resources, along with connecting struggling programs with those with documented success with TPA implementation, could create more opportunities for programmatic learning and improvement.
How Preparation Predicts Teaching Performance Assessment Results in California (brief) by Susan Kemper Patrick with Lillie Ko-Wong is licensed under the Creative Commons Attribution-NonCommercial 4.0 International License.
This research was supported by the Bill & Melinda Gates Foundation. Core operating support for the Learning Policy Institute is provided by the Carnegie Corporation of New York, Heising-Simons Foundation, William and Flora Hewlett Foundation, Raikes Foundation, Sandler Foundation, Skyline Foundation, and MacKenzie Scott. The ideas voiced here are those of the authors and not those of our funders.