School Funding Effectiveness: Evidence From California’s Local Control Funding Formula

Summary
In 2013, California implemented an ambitious school funding reform, the Local Control Funding Formula (LCFF), which allocates state funding by the proportion of unduplicated “high-need” students in the district: those from low-income families, English learners, and those in foster care. Using student-level longitudinal data for all California schoolchildren, the study is the first comprehensive investigation of LCFF’s impacts on student outcomes, including math and reading achievement, grade repetition, school disciplinary incidents, high school graduation, and college readiness. The analyses show that LCFF-induced funding increases significantly improved academic achievement for every grade and subject assessed, reduced grade repetition, enabled lower suspension rates, and increased the likelihood of students graduating from high school and being college-ready. The impact on student achievement grew with years of exposure to increased funding and with the amount of the funding increase. District investments in instructional inputs, including reduced class size, increased teacher salaries, and teacher retention, were associated with improved student outcomes.
The report on which this brief is based can be found here.
Introduction
In 2013, California implemented one of the most ambitious school funding reform efforts the state had experienced in a generation, the Local Control Funding Formula (LCFF). The goal of LCFF was to reduce academic achievement gaps between socioeconomically disadvantaged children and their more advantaged counterparts by committing $18 billion in increased state support, distributed on the basis of pupil needs, to be incrementally distributed over 8 years. This reform was distinctive in two ways. First, its multiyear design pre-committed funds, so districts were assured this would not be a temporary, reversible change. This commitment enabled districts to plan long-term, transformative initiatives rather than one-off expenditures. Second, the funding came with minimal restrictions on how schools could use it, giving fiscal sovereignty to districts.
This study investigates the impacts of LCFF-induced increases in per-pupil spending on student academic achievement and behavioral outcomes. It links district- and school-level information on school resources and per-pupil spending from 1995 to 2019 with longitudinal student data for the full universe of K–12 public school students in California from kindergarten through their school-age years. The analysis focuses particular attention on the rollout period of LCFF implementation from 2013 through 2019. Because LCFF’s $18 billion commitment was implemented incrementally, becoming fully funded in the 2018–19 school year, the study can exploit the staggered timing of implementation of this new progressive funding formula to isolate policy-induced changes in school spending across cohorts and districts at each of grades K–12.
It is the first comprehensive investigation of LCFF’s impacts on student outcomes, examining the causal impacts of multiyear school spending increases on math and reading achievement, grade repetition, school suspension and expulsion rates, high school graduation, and college readiness. It also investigates which uses of funding are associated with improved student outcomes. Further information on the analytic methods are in Appendix A and the main report.
The research finds positive and significant effects of LCFF-induced funding increases on academic outcomes for every grade and subject assessed, and for every school that experienced this new infusion of state funds. The impacts on students’ outcomes grew with years of exposure to increased funding and with the amount of the increase that occurred due to LCFF. Increases in per-pupil spending led to substantial improvements in reading and math achievement, resulted in reductions in grade repetition and the probability of suspensions and expulsions, and increased the likelihood of students graduating from high school and being college-ready. In a test of these conclusions, the study found that districts not receiving LCFF funding did not experience similar gains.
California School Spending and the Local Control Funding Formula
In California, prior to the creation of the LCFF system, school funding was derived from local property taxes supplemented by the state in order to bring each district up to a “revenue limit,” a mostly uniform per-pupil funding allotment. In other words, for districts whose property tax wealth was insufficient to meet the revenue limit, the state supplemented local property taxes until the limit was reached so that funding was equalized across districts. The system allowed for some monetary differentiation for particular purposes, such as transportation or special education, but contained little explicit weighting for student demographic characteristics.
In 2011, California ranked last nationwide in average per-pupil spending adjusted for differences in cost of living (and consistently ranked in the bottom 15 state systems in per-pupil spending in the 10 years leading up to LCFF). In the year immediately preceding LCFF passage, data from the National Assessment of Educational Progress (NAEP) revealed California had among the largest socioeconomic achievement gaps in the nation.
In 2013, California passed LCFF and enacted a temporary sales tax hike to increase and better equalize funding and to counteract school budget shortfalls, which resulted in part from the Great Recession and home foreclosures. Under LCFF, funding is not allocated based on district property wealth, but by the proportion of unduplicated “high-need” students in the district. LCFF defines high-need students as those who are from low-income families, living in foster care, experiencing homelessness, or English learners. About 60% of public school students in California are from families with low incomes. Due to systemic and historic inequities, Black, Hispanic, and Native American students are disproportionately more likely to come from families with low incomes, be living in foster care, experience homelessness, and attend schools with high concentrations of students facing disadvantage. As a result, LCFF has the potential to mitigate racial achievement gaps in addition to socioeconomic achievement gaps.
The LCFF funding formula is characterized by three components: (1) base grant, which varies based on the grade span of the students; (2) supplemental grant, which is equal to 20% of the adjusted base grant for each high-need student; and (3) concentration grant, which is equal to 50% of the adjusted base grant per high-need student in districts with more than 55% high-need students. The concentration grant is explicitly designed to address the substantially greater resource needs of students living in poverty and attending concentrated poverty schools, schools with high proportions of students who are English learners, and student populations who are disadvantaged in multiple ways. In 2018–19, funding allocations totaled:
- Base grant: Approximately $8,000 per pupil (depending on grade level)
- Supplemental grant: $1,600 for each high-need student
- Concentration grant: $5,300 per high-need student in districts with more than 55% high-need students
The uptick in funding caused by the concentration grant for districts with more than 55% high-need students is depicted in Figure 1, with the slope increasing with each year of LCFF implementation. By comparison, in the years before LCFF implementation the funding formula was not nearly as progressive and did not exhibit any kink at 55% high need or beyond.
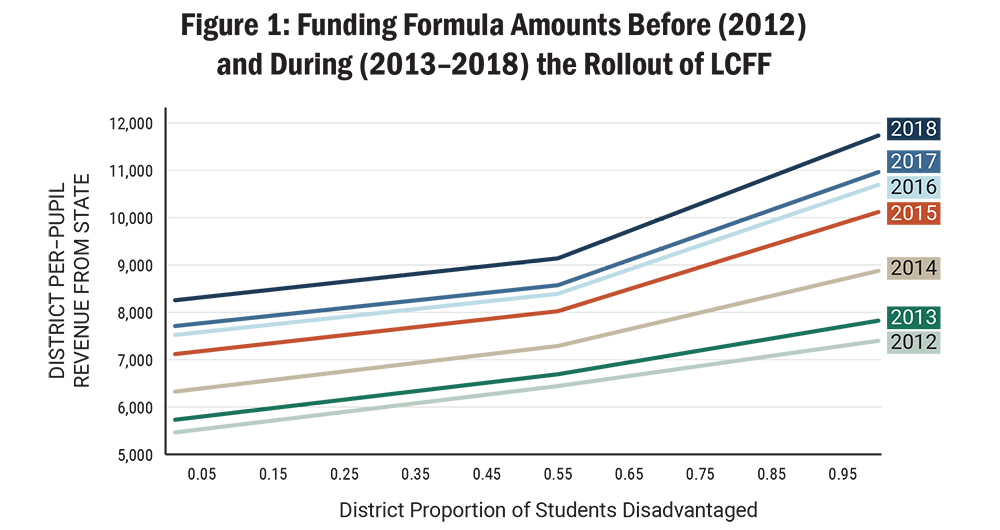
Source: Author analysis of data from the California Department of Education for 2012 through 2018–19 in the Standardized Account Code Structure.
In addition to the tiered allocation system based on student demographic characteristics, there are three other notable qualities of LCFF. Under LCFF, districts have greater discretion in the use of funds than in the prior funding model, in which a large share of funding was for categorical aid, which made allocation options more rigid. Schools that serve 40% or more high-need students can spend these resources schoolwide, and districts with more than 55% high-need students may spend these resources districtwide. The LCFF policy mandates that each district devise a Local Control Accountability Plan—which can be thought of as the recipe and ingredients it will use to prepare a nutritious, equitable learning “meal” for every student, from preschool to graduation. The accountability plan must identify how these resources are principally directed to high-need students, but such decisions can be made based on the specific needs of each district or school, and there are minimal reporting requirements.
A second notable quality of LCFF is its guaranteed multiyear distribution. Traditionally, the uncertainty of available funding from year to year precludes a district’s ability to enact bold, transformative curricular reforms. This is the case for many districts, but it is particularly common for urban and low-income districts. Such fiscal uncertainty in a district, which is similar to the instability experienced by families who live paycheck to paycheck, leads to suboptimal investments, rather than the sustained, high-quality investments that lead to continual improvement. The architects of LCFF aimed to remove this uncertainty and promote transformative investments.
The Impact of LCFF on Student Outcomes
The study examined how LCFF impacted a broad array of student outcomes, including math and reading achievement, grade repetition, school disciplinary incidents, high school graduation, and college readiness.
Math and Reading Achievement
LCFF-induced spending increases resulted in significantly improved achievement in math and reading for all grade levels tested (3rd–8th and 11th grade). Students in districts that received LCFF concentration grants had the largest achievement boost, and the improvements in learning outcomes became more pronounced as students were exposed to increases in funding for more years and as LCFF became fully funded. These results are consistent across modeling strategies, providing confidence in the results. Further, a causal interpretation of the results is supported by the lack of significant spending effects found for Basic Aid districts (which were not subject to state school funding formulas) and the lack of any similar pattern found in the years preceding LCFF’s implementation.
As an example, the analysis compares the achievement of students from the same elementary school across successive cohorts that were exposed to different funding levels as LCFF was incrementally rolled out. For grades 3 through 5, Figure 2 shows the change in math achievement between 2014 (the first year after LCFF passed) and 2018 (when LCFF became fully funded) across districts with different proportions of high-need students. It shows that 3rd- through 5th-grade math achievement significantly improved for students in all districts where the progressivity of the funding formula kicked in (districts receiving LCFF concentration grants). The kink at 55% concentration of high-need students shows larger achievement gains were made under higher LCFF funding levels through the LCFF concentration grants. Among students from the same school, student achievement growth across successive grades was also significantly higher for those exposed to greater LCFF-induced per-pupil spending increases; this pattern was found across all districts that received LCFF funding (not just those that received LCFF concentration grants). The same pattern of results shown for math achievement in grades 3 through 5 were also found for math achievement in middle school grades 6 through 8 and for reading achievement in grades 3–8 (as shown in the full report).
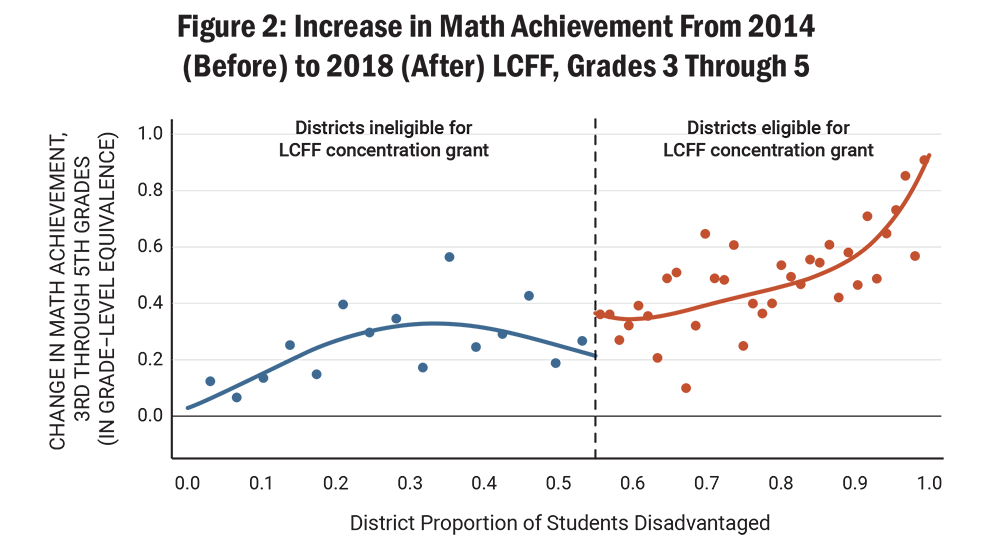
Sources: Author analysis of from the California Department of Education for 2014–2018 in the Standardized Account Code Structure and California Longitudinal Pupil Achievement Data System.
Improvements in math and reading achievement are more pronounced for students who were exposed to the increased resources for more of their school-age years. The results indicate that a $1,000 increase in per-pupil spending experienced in 3 consecutive years resulted in roughly a full grade-level increase in math achievement in grades 3–8 and 11, relative to what the average student achieved prior to the funding increases. Similarly large improvements were found for reading achievement, wherein a $1,000 increase in per-pupil spending experienced in 3 consecutive years resulted in a full grade-level increase in reading in elementary school, middle school, and high school, relative to what the average student achieved prior to the funding increases. Furthermore, evidence from the full report shows improved student achievement for every school that experienced this new infusion of state funds.
Grade Repetition
LCFF-induced increases in school spending also led to significant reductions in the probability that a student would need to repeat a grade, particularly during elementary school. A $1,000 increase in per-pupil spending experienced for 3 consecutive years resulted in a 5 percentage-point reduction in the probability of students experiencing grade repetition by 3rd grade, a corresponding 5.1 percentage-point reduction by 4th grade, and a 5.3 percentage-point reduction in the likelihood of grade repetition by the end of elementary school (5th grade). These grade progression effects were likely enhanced by the coincident introduction of transitional kindergarten over this period.
High School Graduation
Students exposed to LCFF concentration funding displayed an increased likelihood of graduating from high school. For all student groups, a $1,000 increase in the average per-pupil spending experienced throughout one’s high school years (grades 9–12) increased the likelihood of graduating from high school by 8.2 percentage points, on average. The estimated effect is strongest for Black students, but all student groups experienced significant gains.
Similar to other outcomes, effects are strongest for students exposed to larger spending increases and grow by years of exposure to additional funding. Figure 3 shows this dynamic for students from families with low incomes. At the time LCFF was implemented, the graduation rates of students from families with low incomes were equivalent between high schools that would get a large increase or a small increase in LCFF funding. After 1 year of LCFF funding, little had changed. However, after 3 years of additional funding, graduation rates among students from families with low incomes increased by 5 percentage points in schools with large spending increases and by 1 percentage point in schools with small spending increases.
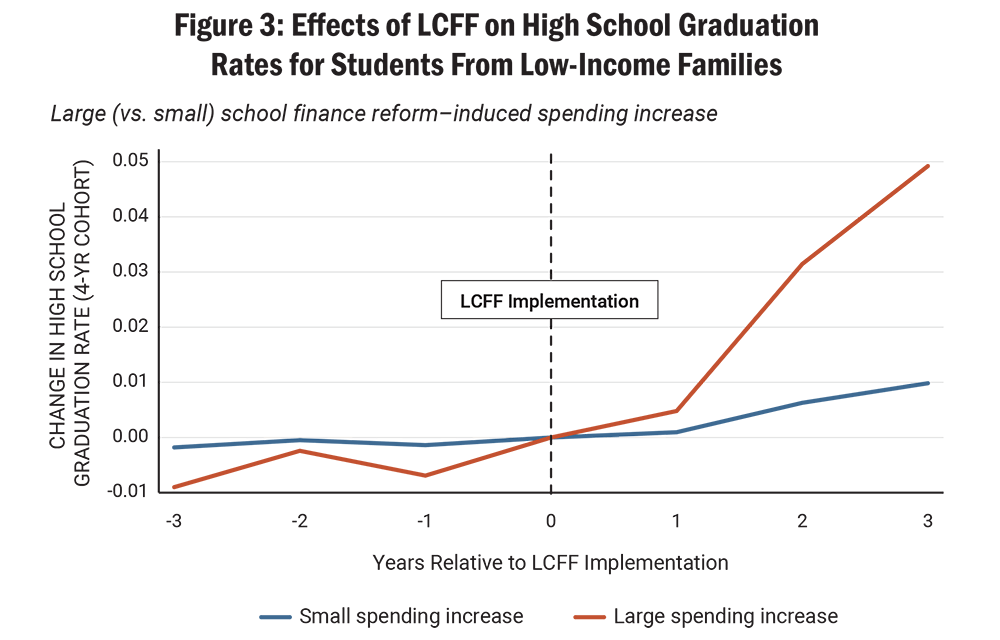
Sources: Author analysis of data from the California Department of Education for 2014–2018 in the Standardized Account Code Structure and California Longitudinal Pupil Achievement Data System.
College Readiness
Across the nation, there are large socioeconomic and racial gaps in college readiness as measured in high school, with students from low-income families, Black students, and Hispanic students having lower college readiness rates than their peers, as defined by their scores on the 11th-grade Smarter Balanced assessment. California’s college readiness gaps in 2014, prior to significant LCFF implementation, were substantial by socioeconomic status and race and ethnicity. While substantial college readiness gaps by socioeconomic status and race and ethnicity remain after LCFF was fully funded, LCFF-induced spending increases have helped narrow those gaps.
LCFF-induced spending increases led to substantial improvements in college readiness. In particular, the results indicate that a $1,000 increase in per-pupil spending experienced in 3 consecutive years of high school (grades 9–11) led to a 9.8 percentage-point increase in the likelihood of meeting college readiness standards in math and a 14.7 percentage-point increase in the likelihood of meeting college readiness standards in reading. These college readiness standards have been found to be significantly predictive of college success.
Suspension and Expulsion
During this same period, California also introduced a major accountability system reform that focused on reducing school suspension rates starting in 2013. As the state launched the accountability reform, these increases in school funding enabled districts to support changes in practice through investments in teacher professional development, more counselors, and smaller classes. Beyond the statewide effects of the state accountability reform that encouraged reductions in suspension rates, the results indicate LCFF-induced increases in school spending were associated with significant reductions in the annual incidence of suspensions and expulsions across all grades (3rd–10th), with effects greater for boys than girls, and with larger effects in high school relative to elementary and middle school. In particular, the results indicate, on average, that a $1,000 increase in per-pupil spending experienced for 3 consecutive years resulted in a 5 to 6 percentage-point reduction in the likelihood of being suspended or expelled in a given year of high school for boys and a 3 percentage-point reduction for girls. The impacts for Black students are striking and are the most pronounced. The evidence reveals that a $1,000 increase in per-pupil spending experienced for 3 consecutive years (grades 8–10) resulted in an 8 percentage-point reduction in the likelihood of suspension or expulsion in high school (10th grade) for Black boys and a 5 percentage-point reduction in the probability of suspension or expulsion for Black girls.
What Type of Spending Matters Most?
LCFF-induced increases in per-pupil spending, and particularly the concentration grant funding under LCFF, led to improved achievement, graduation rates, and college readiness. This begs the question—how did districts invest the additional resources, and which investments resulted in the largest improvements to student outcomes? To investigate which types of resource allocations and school inputs are systematically most productive to boost student achievement, this study looks at the array of different spending categories (e.g., salaries) and a set of school inputs that can change with additional resources (e.g., class size) in relation to student achievement outcomes.
Analyses find that increases in instructional expenditures appear to be the input associated with the largest consistent boost in student performance. The results reveal that roughly 84% of the variation in school spending effectiveness can be explained by instructional expenditures. These are predominantly driven by the trio of combined funding impacts of class size reductions, teacher salary increases, and reductions in teacher turnover. Comporting with prior research, this analysis found these three school inputs—each related to the sustainment of a strong, stable teacher workforce—mattered the most:
- Class size reductions: Class size reductions often correspond with improved social environments in schools and fewer students exhibiting problem behaviors. Inversely, higher student-to-teacher ratios impact teachers’ instructional effectiveness by placing greater demand on classroom management and impairing teachers’ ability to offer individualized attention to students with higher and lower levels of preparation and learning. One commonly cited experiment found that smaller class sizes led to significant improvements in students’ math and reading achievement (about 0.15 standard deviations in terms of average math and reading scores measured after each grade for 4 years).
- Increases in teacher salaries: Teacher compensation influences recruitment and retention and is associated with the level of teacher skill that districts can maintain—the capacity of a school’s instructional staff to effectively execute classroom curricula and support learning. Low levels of teacher compensation, especially common in high-poverty schools, are associated with economic adversity, which in turn can negatively impact teachers’ “psychological load”—including incidences of depression, stress, and emotional exhaustion—and inhibit their classroom performance.
- Increases in teacher retention: On average, 1 in 5 teachers leaves the profession within the first 5 years, and that proportion is as high as 1 in 2 in high-poverty districts. Teacher–student relationships—a critical element of classroom quality and active learning—are disrupted when teachers leave schools during the school year. Additionally, teachers hired to replace those who leave typically have lower levels of experience and are less effective than the teachers they replace. Higher salaries, professional development opportunities, and adequate staffing can contribute to teacher retention.
Increases in the number of guidance counselors, health services, and funding for teacher professional development were also significantly and positively associated with higher school spending effectiveness.
While improving school facilities is an important investment for districts, spending increases on school facility construction and building maintenance were not significantly associated with measurable improvements in academic achievement. Increased district spending on previously accrued teacher pension debt also was not associated with improved achievement.
Conclusion
This study finds that LCFF-induced increases in school spending led to significant improvements in academic achievement for every grade and subject assessed, reduced grade repetition, and increased the likelihood of students graduating from high school and being college-ready. These increases also supported reduced levels of student suspension and expulsion from school. The robustness of the significant positive effects of multiyear per-pupil spending increases on all student outcomes measured for each grade and subject across different models and subgroups provides compelling evidence that the estimated impacts are not driven by any single group of students or districts, nor confined to a single outcome. Not surprisingly, instructionally focused dollars are most strongly associated with improved student academic outcomes. In particular, expenditures that reduce class sizes, increase teacher salaries, and reduce teacher turnover—all of which are associated with a stronger, more stable teaching force—promoted higher academic achievement. The findings provide compelling evidence that school spending matters and providing additional resources to support high-need students pays dividends.
Appendix A: Methods
The study pools all test-assessed years (grades 3–8 and 11) so that the analysis includes all observations for which student achievement is available. The student achievement outcomes are National Assessment of Educational Progress (NAEP)-normed and converted into grade-level-equivalent units, separately for math and reading, so that standardized student outcomes can be compared across kindergarten cohorts, years, grades, and subjects, relative to the national average achievement for the cohort that entered kindergarten in 2005 (which is the last California kindergarten cohort that would not have been exposed to LCFF through 8th grade). All models are run separately by subject (math; reading), and the impacts of per-pupil spending on achievement are allowed to differ by years since kindergarten (“grade”).
To address potential bias, one must account for the following (which our models do):
- Pre-existing (baseline) school-specific persistent differences in the level of achievement
- Pre-existing (baseline) school-specific persistent differences in the average growth rate of achievement
- Common statewide trends
- Years since kindergarten (“grade”)
The research design employs a difference-in-difference approach that facilitates the following three comparisons that each support valid causal inferences of the impacts of LCFF-induced increases in per-pupil spending (experienced over multiple years) on student achievement. In particular, these difference-in-difference comparisons (i.e., “apples-to-apples” comparisons) include comparisons of the following:
- Students from the same school across cohorts evaluated at the same grade (exploits differences in the duration of exposure and intensity of dosage)
- Students from same school and same kindergarten cohort across successive grades (exploits differences in the duration of exposure and intensity of dosage)
- Student achievement growth among students from same cohort and same grade across districts (exploits only differences in district-specific dosage, as there are no duration of exposure differences for these comparisons by construction)
A striking feature of the findings is that each of the three difference-in-difference comparisons yield broadly similar results on the estimated effects of per-pupil spending on achievement. The fact that the results are similar across all three difference-in-difference comparisons bolsters the strength of evidence on the significant role of school spending. The third comparison effectively involves comparisons of student achievement growth and leverages the kink in the funding formula at 55% district disadvantage (that only exists after LCFF implementation) and employs the regression kink design within the difference-in-differences framework. In particular, when comparing students in the same cohort and same grade, it is important to note that there are no significant differences in funding for districts at 0–55% disadvantage, as the progressivity in funding formula kicks in at >55% district disadvantage (i.e., holding constant kindergarten cohort-by-grade (fixed) effects).
The two-stage least squares instrumental variables (2SLS-IV) models combine all three aforementioned sources of difference-in-difference comparisons and isolate exogenous variation in LCFF-induced increases in per-pupil spending (experienced over multiple years) on student achievement by years since kindergarten.
The robustness of the significant positive relationship between multiyear per-pupil spending on all student outcomes measured for each grade and subject across different models and subgroups provides compelling causal evidence that the estimated impacts are not driven by any single group of students or districts, nor confined to a single outcome, but rather reflect a general pattern that school spending matters. These beneficial effects of per-pupil spending increases on learning outcomes are apparent among all schools that experienced this new infusion of funds (including those below 55% district disadvantage and those above 55% disadvantage). A causal interpretation of these results is further supported by the lack of significant spending effects found for Basic Aid districts (which were not subject to state school funding formulas) and the lack of any similar pattern found in the years preceding LCFF’s implementation, as documented in the placebo tests and falsification exercises.
School Funding Effectiveness: Evidence From California’s Local Control Funding Formula (brief) by Rucker Johnson is licensed under a Creative Commons Attribution-NonCommercial 4.0 International License.
This research was supported by the William T. Grant Foundation; PACE; and a University of California, Berkeley (UC Berkeley) Population Center pilot grant. Core operating support for LPI is provided by the Heising-Simons Foundation, William and Flora Hewlett Foundation, Raikes Foundation, Sandler Foundation, and MacKenzie Scott. LPI is grateful to them for their generous support. The ideas voiced here are those of the author and not those of our funders.