Where Is Teaching Most Attractive and Equitable?

Summary
This brief introduces the State of the Teacher Workforce interactive map, which includes more than 40 indicators and 2 summary ratings that describe teaching conditions and equitable access to well-qualified teachers in all 50 states and the District of Columbia. Updated in 2024, the map draws from recent national data sources, including the 2021–22 Teacher Follow-Up Survey and the 2020–21 Civil Rights Data Collection, to incorporate the latest information on teacher retention, certification, completion in teacher preparation programs, and student enrollment. The data enables policymakers to monitor conditions in their states and make comparisons with other states and the national average. There are significant variations in teaching conditions across states, with Midwestern and Northeastern states generally offering more competitive salaries and more supportive working environments. The map also shows that many states do not provide equitable access to certified and experienced teachers for students of color and students in low-income households, including large inequities in several states that have high proportions of these students. By focusing on both teaching attractiveness and teacher equity, the map highlights states that have been relatively effective at creating supportive teaching conditions to attract a well-qualified teacher workforce and ensure that students have equitable access to these teachers.
Introduction
Teachers are critical for student success,Burroughs, N., Gardner, J., Lee, Y., Guo, S., Touitou, I. ... & Schmidt, W. (2019). A review of the literature on teacher effectiveness and student outcomes. In Teaching for excellence and equity, Vol. 6 (pp. 7–17). IEA Research for Education. Springer, Cham. but many schools struggle to fill their classrooms with well-qualified teachers who are fully prepared and experienced.Nguyen, T. D., Lam, C. B., & Bruno, P. (2022). Is there a national teacher shortage? A systematic examination of reports of teacher shortages in the United States [EdWorkingPaper No. 22-631]. Annenberg Institute for School Reform at Brown University; Sutcher, L., Darling-Hammond, L., & Carver-Thomas, D. (2016). A coming crisis in teaching? Teacher supply, demand, and shortages in the U.S. Learning Policy Institute. These teachers are generally more effective and less likely to leave their schools or the profession, compared to uncertified or inexperienced teachers.Clotfelter, C. T., Ladd, H. F., & Vigdor, J. L. (2010). Teacher credentials and student achievement in high school: A cross-subject analysis with student fixed effects. Journal of Human Resources, 45(3), 655–681; Kini, T., & Podolsky, A. (2016). Does teaching experience increase teacher effectiveness? A review of the research. Learning Policy Institute; Carver-Thomas, D., & Darling-Hammond, L. (2017). Teacher turnover: Why it matters and what we can do about it. Learning Policy Institute; Nguyen, T. D., Pham, L. D., Crouch, M., & Springer, M. G. (2020). The correlates of teacher turnover: An updated and expanded meta-analysis of the literature. Educational Research Review, 31, 100355. When schools are unable to fill vacancies, they typically cancel classes, increase class sizes, or rely on a revolving door of substitute teachers.Cohen, G. (2023, September 11). Doubling up on classrooms, using online teachers and turning to support staff: How schools are dealing with the ongoing teacher shortage. CNN. (accessed 06/07/2024). Teacher shortages are persistent and impact all states.U.S. Department of Education. (n.d.). Teacher shortage areas [Data set]. They are highest in schools serving more students of color and students from low-income backgrounds, those who are already furthest from opportunity.Cardichon, J., Darling-Hammond, L., Yang, M., Scott, C., Shields, P. M., & Burns, D. (2020). Inequitable opportunity to learn: Student access to certified and experienced teachers. Learning Policy Institute.
Not only do shortages undermine learning conditions for students, the current context suggests that shortages might continue to be a persisting problem. Interest in teaching is at its lowest point in decades,Kraft, A. M., & Lyon, M. A. (2024). The rise and fall of the teaching profession: Prestige, interest, preparation, and satisfaction over the last half century [EdWorkingPaper: 22-679]. Annenberg Institute at Brown University. and teachers are more than twice as likely as other working adults to report frequent job-related stressSteiner, E. D., Doan, S., Woo, A., Gittens, A. D., Lawrence, R. A., … Schwartz, H. L. (2022). Restoring teacher and principal well-being is an essential step for rebuilding schools: Findings from the State of the American Teacher and State of the American Principal surveys. RAND Corporation. as they deal with increasing student mental health challengesAbrams, Z. (2023, January 1). Kids’ mental health is in crisis: Here’s what psychologists are doing to help. Monitor on Psychology, 54(1). American Psychological Association. and declines in student performance, exacerbated during the COVID-19 pandemic.The Nation’s Report Card. (n.d.). NAEP Long-Term Assessment results: Reading and mathematics. Scores decline again for 13-year-old students in reading and mathematics. The end of federal Elementary and Secondary School Emergency Relief (ESSER) funds in 2024, especially if coupled with state funding cuts, may also create further instability in schools’ staffing, as some districts may need to eliminate teaching or student support positions that were enabled by these funds.Lefebvre, J., & Master, S. (2024). Expiration of federal K–12 emergency funds could pose challenges for states. Center on Budget and Policy Priorities.
Given these challenges, it is critical to understand the current conditions of the teaching profession that are important for attracting and retaining well-qualified teachers in the profession. These conditions, such as salaries and working conditions, vary substantially across states, as do school resources, teacher qualifications, and turnover.
The State of the Teacher Workforce: A State-by-State Analysis of Factors Influencing Teacher Shortages, Supply, Demand, and Equity, an interactive map updated in 2024, includes more than 40 indicators describing teaching conditions for the more than 3 million public school teachers in all 50 states and the District of Columbia. These indicators can be used to inform policy strategies to build a strong and diverse teacher workforce, address teacher shortages, and ensure equitable access to well-qualified and experienced teachers. So where are the best places to teach in the United States? Generally, compensation and other teaching conditions are more supportive in California, Kansas, Kentucky, Nebraska, New Hampshire, New Jersey, New York, North Dakota, Vermont, Wisconsin, and Wyoming. For students, access to well-qualified teachers is more equitable in Connecticut, Hawaii, Iowa, Nebraska, North Dakota, Oregon, South Carolina, South Dakota, Vermont, and West Virginia. (See the map for exact ratings.)
About the Map
The map draws from recently released national data sources, including the 2021–22 Teacher Follow-Up survey and the 2020–21 Civil Rights Data Collection, to identify the conditions of teaching in each state, as well as factors influencing teacher supply and demand.The updated map includes data from the 2021–22 Teacher Follow-Up Survey, the 2020–21 Civil Rights Data Collection, the 2022–23 Common Core of Data, and the 2021–22 Title II data (all overseen by the Department of Education). For details on data sources used for the map, refer to the related technical supplement: García, E., Leung-Gagné, M., & Patrick, S. K. (2024). The state of the teacher workforce: A state-by-state analysis of the factors influencing teacher shortages, supply, demand, and equity [Technical supplement—2024]. Learning Policy Institute. It also illustrates the extent to which children have equitable access to certified and experienced teachers and access to a racially diverse teaching workforce. In addition, a companion piece compiling state-reported data provides details on teaching positions left vacant or filled by teachers without full certification—key indicators of the extent of shortages.Franco, M., & Patrick, S. K. (2023). State teacher shortages: Teaching positions left vacant or filled by teachers without full certification. Learning Policy Institute.
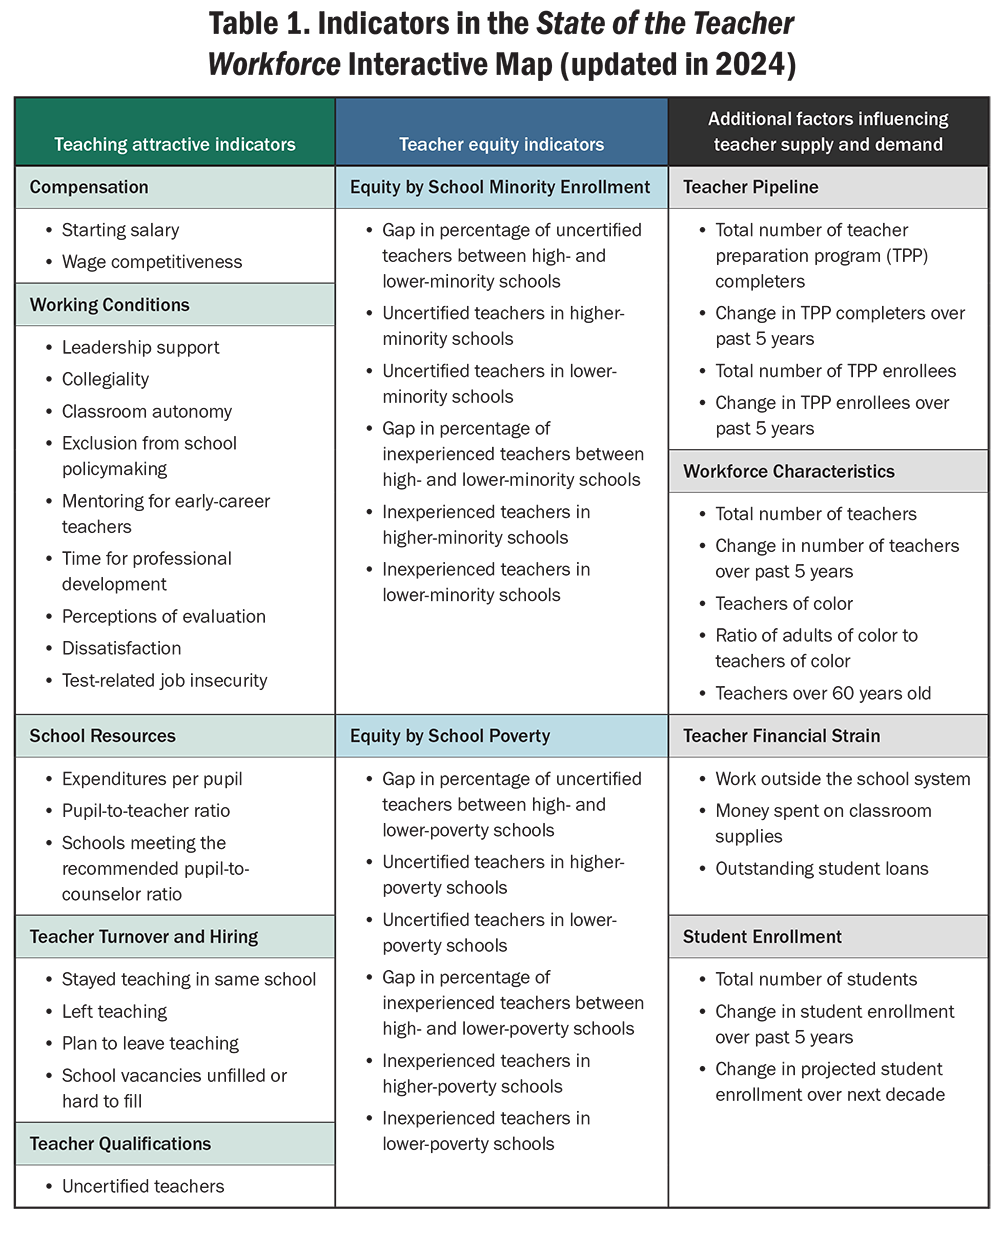
The State of the Teacher Workforce map is part of the Learning Policy Institute’s ongoing research on strategic policies that can build and sustain a strong, stable, and diverse teacher workforce. It illustrates over 40 indicators (see Appendix for a full list) and two summary ratings that capture:
- Teaching attractiveness: The extent to which there are supportive conditions in each state for teacher recruitment and retention, including compensation, working conditions, school resources, teacher turnover and hiring, and qualifications of the teacher workforce.
- Teacher equity: The extent to which students in high- and low-poverty schools and those in high- and low-minority schools in each state have equitable access to certified and experienced teachers.To identify “higher-minority” and “lower-minority” schools, we sorted schools in each state into quartiles based on the percentage of students identified in the data set as American Indian or Alaska Native, Asian, Black or African American, Hispanic or Latino of any race, Native Hawaiian or Other Pacific Islander, or Two or more races. Schools in the top and bottom quartiles were categorized as higher- and lower-minority schools, respectively. Similarly, to categorize “higher-poverty” and “lower-poverty” schools, we sorted schools in each state into quartiles based on the percentage of students eligible for free or reduced-price lunch (FRPL). Schools in the top and bottom quartiles were categorized as higher- and lower-poverty schools, respectively. For more about the data sources and methodology, see our technical appendix: García, E., Leung-Gagné, M., & Patrick, S. K. (2024). The state of the teacher workforce: A state-by-state analysis of the factors influencing teacher shortages, supply, demand, and equity [Technical supplement—2024]. Learning Policy Institute.
The map focuses on state-level measures, since state policies can greatly influence the condition of the teacher workforce. For example, state policies on teacher preparation, accountability, and funding formulas play a large role in shaping learning environments and, in turn, teacher working conditions. Based on the combined indicators, we rate states on their attractiveness to teachers and their equity in distributing well-qualified teachers to different schools. These ratings represent an average of how states perform on various indicators and are relative rather than absolute measures. This means that a state with a high rating is doing better compared to other states in the country but may still have considerable room for improvement. For instance, even in states with the highest equity ratings, some students have less access to certified and experienced teachers. For more on the map’s data sources and methodology, including details about the ratings and indicators, see the associated Technical Supplement.García, E., Leung-Gagné, M., & Patrick, S. K. (2024). The state of the teacher workforce: A state-by-state analysis of the factors influencing teacher shortages, supply, demand, and equity [Technical supplement—2024]. Learning Policy Institute.
Where are conditions for teaching most attractive?
The map’s teaching attractiveness rating summarizes 19 factors that can support recruiting and retaining an effective, stable, and diverse teacher workforce, including compensation and working conditions.Borman, G. D., & Dowling, N. M. (2008). Teacher attrition and retention: A meta-analytic and narrative review of the research. Review of Educational Research, 78(3), 367–409; Carver-Thomas, D., & Darling-Hammond, L. (2017). Teacher turnover: Why it matters and what we can do about it. Learning Policy Institute; Nguyen, T. D., Pham, L. D., Crouch, M., & Springer, M. G. (2020). The correlates of teacher turnover: An updated and expanded meta-analysis of the literature. Educational Research Review, 31, 100355. Compensation influences who may be interested in becoming a teacher and whether teachers enter or stay in the profession; low compensation is often cited as a top barrier for college students considering a career in teaching.Sherratt, E. (2023). Teacher compensation: Busting the myths and generating dialogue. WestEd. Other working conditions, like supportive school leadership, may be equally critical to retaining teachers and building a strong, stable, and diverse workforce.Boyd, D., Grossman, P., Ing, M., Lankford, H., Loeb, S., & Wyckoff, J. (2011). The influence of school administrators on teacher retention decisions. American Educational Research Journal, 48(2), 303–333. García, E., Han, E., & Weiss, E. (2022). Determinants of teacher attrition: Evidence from district-teacher matched data. Education Policy Analysis Archives, 30(25). Additionally, the teaching attractiveness indicators capture school resources, teacher qualifications, and staffing metrics, including the share of teachers who left teaching in each state.

Source: Learning Policy Institute. (2024). The state of the teacher workforce: A state-by-state analysis of the factors influencing teacher shortages, supply, demand, and equity [Interactive map].
Based on our analysis, California, Kansas, Kentucky, Nebraska, New Hampshire, New Jersey, New York, North Dakota, Vermont, Wisconsin, and Wyoming have the highest teaching attractiveness ratings, indicating that teachers in these states experience, on average, more competitive salaries and more supportive teaching conditions. As shown in Figure 1, with the exception of California and Kentucky, these highest-rated states are clustered in the Midwestern and Northeastern United States, while states in the Southeastern and Southwestern United States tend to have lower teaching attractiveness ratings.
Where do students have equitable access to well-qualified teachers?
The teacher equity rating summarizes the degree to which students’ access to certified and experienced teachers varies across schools within each state. The eight indicators in this rating compare whether schools serving more students of color or more students from low-income families are as likely to employ uncertified or inexperienced teachers as schools serving higher proportions of white students or students from more economically advantaged families. Although there are other measures of teaching quality and effectiveness, certified teachers—those entering the classroom having met all state standards—tend to have more positive impacts on student outcomes and are more likely to stay in the profession for a longer period of time.Clotfelter, C. T., Ladd, H. F., & Vigdor, J. L. (2010). Teacher credentials and student achievement in high school: A cross-subject analysis with student fixed effects. Journal of Human Resources, 45(3), 655–681; Kini, T., & Podolsky, A. (2016). Does teaching experience increase teacher effectiveness? A review of the research. Learning Policy Institute; Carver-Thomas, D. & Darling-Hammond, L. (2017). Teacher turnover: Why it matters and what we can do about it. Learning Policy Institute; Nguyen, T. D., Pham, L. D., Crouch, M., & Springer, M. G. (2020). The correlates of teacher turnover: An updated and expanded meta-analysis of the literature. Educational Research Review, 31, 100355. Additionally, teachers tend to become more effective with experience, as measured by student learning and non-test outcomes like attendance and classroom behavior.Ladd, H. F., & Sorensen, L. C. (2017). Returns to teacher experience: Student achievement and motivation in middle school. Education Finance and Policy, 12(2), 241–279; Papay, J. P., & Kraft, M. A. (2015). Productive returns to experience in the teacher labor market: Methodological challenges and new evidence on long-term career improvement. Journal of Public Economics, 130, 105–119; Kini, T., & Podolsky, A. (2016). Does teaching experience increase teacher effectiveness? A review of the research. Learning Policy Institute.

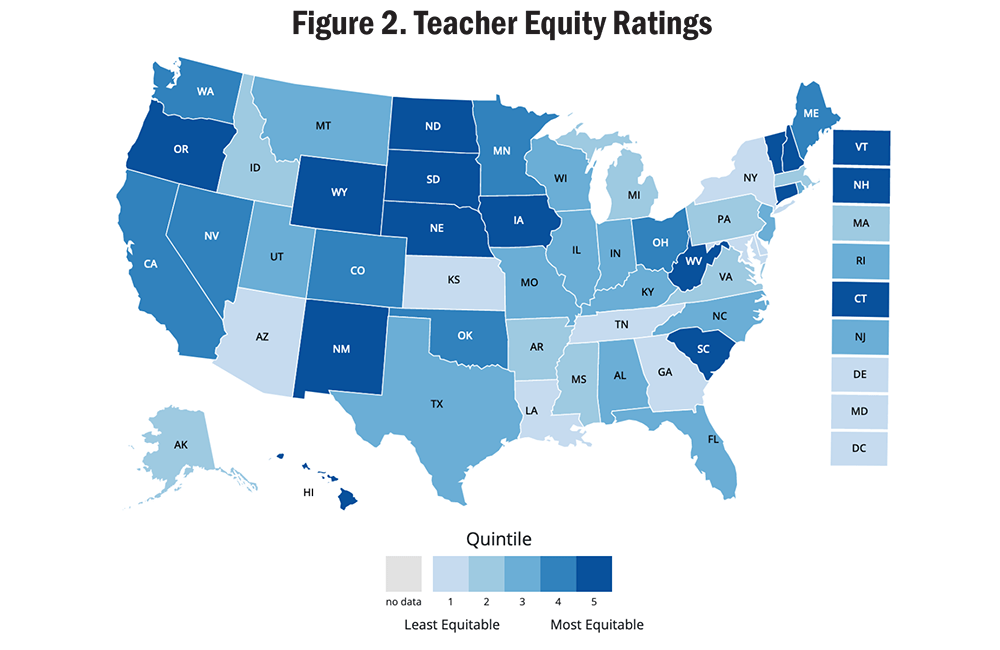
Source: Learning Policy Institute. (2024). The state of the teacher workforce: A state-by-state analysis of the factors influencing teacher shortages, supply, demand, and equity [Interactive map].
Relative to other states, Connecticut, Hawaii, Iowa, Nebraska, North Dakota, Oregon, South Carolina, South Dakota, Vermont, and West Virginia have the most equitable distribution of well-qualified teachers (see Figure 2). Several of these states tend to have smaller and less racially diverse populations. Importantly, gaps in access to certified and experienced teachers between those in high-poverty and low-poverty schools, and those schools with high and low proportions of students of color, are present in most states. Several states with high proportions of students of color and students from low-income backgrounds—including Arizona, the District of Columbia, Georgia, Louisiana, Maryland, and New York—have the least equitable access to certified and experienced teachers across their schools. Such findings point to the need for these states to further their efforts to ensure that all their students have access to well-qualified teachers, regardless of race/ethnicity or family economic status.
Ways to Use the Map
Along with the two ratings described above, the interactive map includes more than 40 indicators that capture valuable information about the teacher workforce in each state and nationally. The map can be used for multiple purposes, including to:
- Assess how well states are progressing toward specific goals or recommended parameters, such as having average starting teaching salaries above a certain threshold or ensuring a sufficient number of school counselors given student enrollment
- Identify areas of strength and weakness for a state in terms of teacher working conditions, equitable distribution of well-qualified teachers, or other indicators of the state of the teacher workforce. The map’s downloadable PDFs summarize all the data points for a given state
- Compare a state to other states or the national average on all indicators, including starting salary, mentoring for early career teachers, or uncertified teachers in higher-poverty schools
- Identify states that are relatively successful in a given area, thus allowing policymakers to seek out examples of relevant policies and programs in those states
Additional Resources
The interactive map is accompanied by other resources, which can help meet different needs and goals of policymakers, education leaders, researchers, and other users interested in education. Among these:
- Downloadable PDFs, accessible though the map, provide two-page summaries for each state and for the United States, showing all the indicators, ratings, quintiles, and a comparison between the state and the national average. For example, see the summaries for the U.S. and Alabama.
- Technical Supplement that includes the map’s data sources and methodology, including details about the ratings and indicators.
- Resource that compiles state-reported data and provides details on teaching positions left vacant or filled by teachers without full certification.
Why is it important to consider both teaching attractiveness and teacher equity?
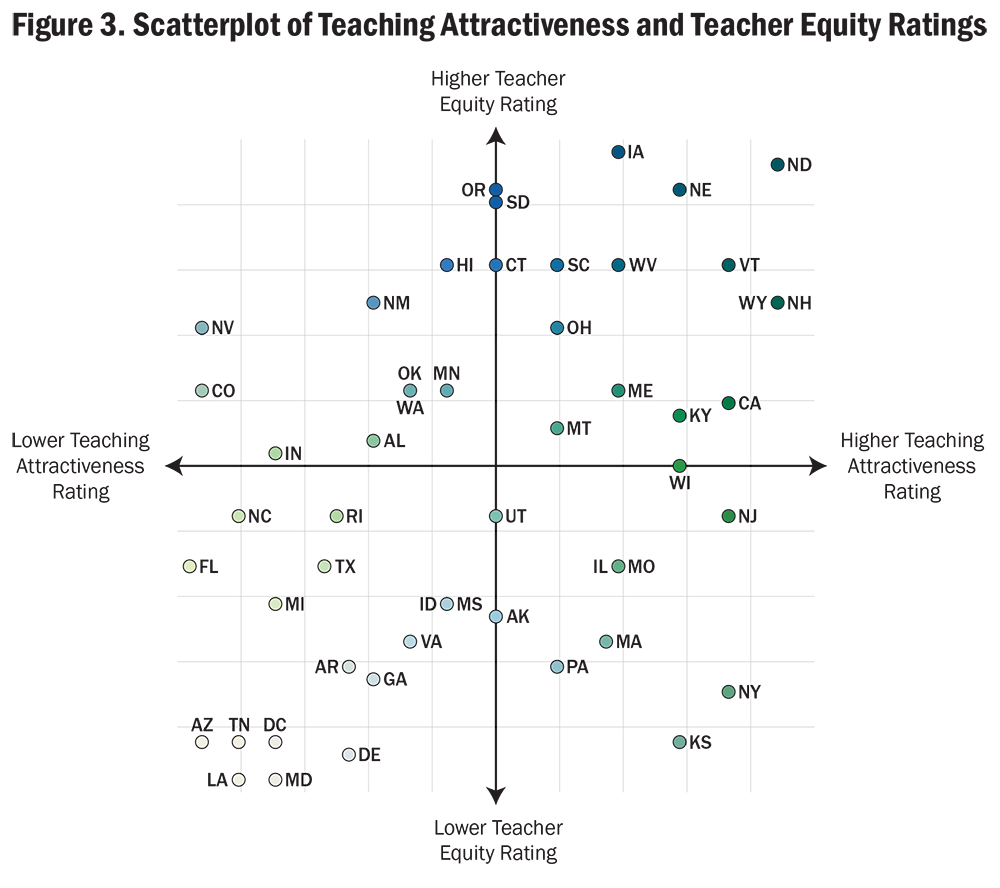
Offering attractive teaching conditions helps to recruit and retain a well-qualified and diverse teacher workforce, while distributing teachers equitably across schools helps ensure that all students have access to certified and experienced teachers. Given that an excellent education system should pursue both goals, it can be useful to consider the map’s two ratings together to assess a state’s teacher workforce. States with high attractiveness but low equity could experience increasing disparities in both student and teacher outcomes, while high equity in a less attractive environment would indicate insufficient resources and support overall. States that are rated high in both teaching attractiveness and teacher equity may serve as models for policymakers in other places. Figure 3 shows states’ relative positions in terms of both their teaching attractiveness and teacher equity ratings.

Source: Learning Policy Institute. (2024). The state of the teacher workforce: A state-by-state analysis of the factors influencing teacher shortages, supply, demand, and equity [Interactive map].
As shown in Figure 3, Iowa, Nebraska, New Hampshire, North Dakota, Vermont, West Virginia, and Wyoming have relatively high ratings for both teaching attractiveness and equity. These states tend to be in the Midwest and Northeast and are less racially diverse compared to other states. In contrast, Arizona, the District of Columbia, Louisiana, Maryland, and Tennessee are rated low on both measures. They tend to be in the South with a relatively diverse student population. Other states may be ranked high in one of the ratings, but not the other. For example, Kansas and New York have relatively high teaching attractiveness ratings, but their certified and experienced teachers are not equitably distributed across schools. Policymakers in these states should prioritize improving both teaching attractiveness and equity to ensure that all students benefit from a well-qualified teacher workforce.
What other factors influence the supply and demand of teachers?
Beyond the ratings described above, other factors also shape the supply and demand for teachers. In the interactive map, we provide 15 additional indicators that state policymakers may want to consider when thinking about state efforts to support an adequate and diverse supply of teachers. These include indicators describing the teacher pipeline, student enrollment, workforce demographic characteristics, and teacher financial strain. For example, the map includes trends over time in the supply of new teachers by tracking enrollment and completion in the state’s teacher preparation programsFor more on trends in teacher preparation enrollment and completion, see: Patrick, S. K. (2023). What does the future of the teacher workforce look like? It depends on where you live. Learning Policy Institute. and trends in student enrollment that may influence the demand for teachers. The map also offers information about the characteristics of the state’s current teacher workforce, such as the share of teachers approaching retirement age and the relative racial diversity of the teacher workforce compared to the state’s workforce.For more on teacher diversity, see: Carver-Thomas, D., Leung-Gagné, M., & García, E. (Forthcoming). The state of teacher diversity [Working title]. Learning Policy Institute; Carver-Thomas, D. (2018). Diversifying the teaching profession: How to recruit and retain teachers of color. Learning Policy Institute. The map also captures potential financial strains affecting teachers, including the percentage of teachers with outstanding student loans and teachers’ unreimbursed spending on school supplies.For more on student loans among teachers, see: García, E., Wei, W., Patrick, S. K., Leung-Gagné, M., & DiNapoli, M. A., Jr. (2023). In debt: Student loan burdens among teachers. Learning Policy Institute. For more on unreimbursed money spent by teachers on school supplies, see: García, E., Leung-Gagné, M., Patrick, S. K., & Darling-Hammond, L. (2023). Underpaid and undersupplied: The hidden costs of teaching in America. Learning Policy Institute.
The interactive map and the state-level data scan depict the state of the teacher workforce and teacher shortages, which can inform policymaking in supporting and strengthening the teacher workforce and ensuring that all students have access to well-qualified teachers. The Learning Policy Institute has numerous other resources that identify and describe different policy strategies to strengthen the teacher workforce. For the most up-to-date resources, please see our website pages on Educator Diversity, Educator Quality, Teacher Preparation and Professional Learning, and Teacher Recruitment, Retention, and Shortages.
Appendix: List of Indicators in the Map

Where Is Teaching Most Attractive and Equitable? (brief) by Melanie Leung-Gagné, Susan Kemper Patrick, and Emma García is licensed under a Creative Commons Attribution-NonCommercial 4.0 International License.
Core operating support for the Learning Policy Institute is provided by the Carnegie Corporation of New York, Heising-Simons Foundation, William and Flora Hewlett Foundation, Raikes Foundation, Sandler Foundation, Skyline Foundation, and MacKenzie Scott. The ideas voiced here are those of the authors and not those of our funders.
